The Necessity
With investment performance measurement being vital to the objective of investment itself – performance upon the investment made – it is necessary to measure the process and results
of a performance measurement system and department. In doing so, the department and its stakeholders will ascertain and can therefore summarily communicate:
- How many reports are delivered per month, year-to-date and other pertinent timeframes;
- How many data points are delivered per month, year-to-date and other pertinent timeframes;
- The percentage of reports/data delivered with correct data the first time (in total);
- The percentage of reports/data delivered with correct data the first time (where the performance measurement system or department controlled the outcome);
- The system’s/department’s overall Six Sigma-style score with little calculation overhead or ongoing maintenance;
- Trends in the levels of service and quality by the system and department; and finally
- Context when and if performance republishings or restatements become necessary.
Without such knowledge one could manage a department day to day but never lead a department, its staff or its stakeholders beyond the near-term. It is the practical goal of this
conversational article to concisely inform the reader how to implement the tools to regularly attain this knowledge. To that end, the article will introduce the FTR (first-time-right) ratio;
discuss how to easily develop and maintain its resulting information for a system or department; discuss its Six Sigma implications and benefits (with an conceptual overview of Six Sigma and how it
applies well to performance systems); provide comparative related data from another industry; and discuss extending the benefits beyond the FTR ratio itself.
The First-Time Right (FTR) Ratio
Clients care about accuracy of the data upon which they make decisions, and in business lingo “if we care, we measure.” Service providers care about their clients’ needs and
efficiency in achieving them, a symptom of which is little to no rework – i.e., “get it done right the first time.” The aptly named first-time-right (FTR) ratio serves both these
needs. It has both an external focus and an internal focus. Externally it focuses on the client; internally it can delineate where errors reside – notably are they within or upstream of the
performance measurement group or system. The FTR ratio splendidly balances customer focus and internal accountability. It delivers this balance at little cost in terms of both start up and
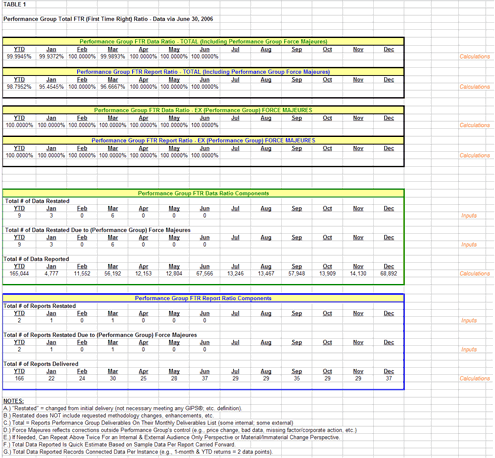
ongoing maintenance. The FTR ratio further provides the raw materials to produce a trend line of quality to see if the process has been measurably improved or not. Table 1 presents the
proposed FTR ratio report for a performance measurement group for half a calendar year. The following paragraphs will walk through this proposed FTR report in Table 1 and its findings.

The proposed FTR ratio report in Table 1 has six key sections. They are:
- The total Performance Measurement Group (PMG)’s FTR Data Ratio (including PMG Force Majeures1),
- The total PMG’s FTR Report Ratio (including PMG Force Majeures),
- The PMG’s FTR Data Ratio (excluding PMG Force Majeures),
- The PMG’s FTR Report Ratio (excluding PMG Force Majeures),
- The ratio components for the FTR Data Ratios (including and excluding PMG Force Majeures),
- The ratio components for the FTR Report Ratios (including and excluding PMG Force Majeures).
In Table 1’s first section, we see the department’s percentage of total data reported correctly the first time was 99.9945% in the first six months. In Table 1’s second section,
we see the department’s percentage of total reports published correctly the first time was 98.7952%. Ultimately, these two numbers are what the client base cares about. Table 1’s third
and fourth sections mirror the first two but remove the errors beyond the performance measurement group’s direct control. This recognizes that performance groups have a strong reliance
upon the data provided them by index vendors and accounting systems, etc. It is through this recognition, and its quantification in the output received by the client, that upstream vendors,
whether internal or external, can realize their part in client service and need fulfillment. Table 1’s remaining two sections provide the raw material that goes into the formulas resulting in
output of Table 1’s first four sections. See the Appendix for calculation details by example. Table 1’s remaining two sections additionally indicate the reports and data produced for
each month and for the total six month year-to-date period.
Ease of Developing and Maintaining the Data Behind the FTR Ratios
In this section, we’ll address developing and maintaining the data behind the FTR ratios. The intent is to keep it simple in order to reap the benefits at little cost. If one wanted absolute
precision in the resulting metric, one would engage in a lengthy Six Sigma exercise.2 Instead the first key to balancing simplicity and useful accuracy is to go through the
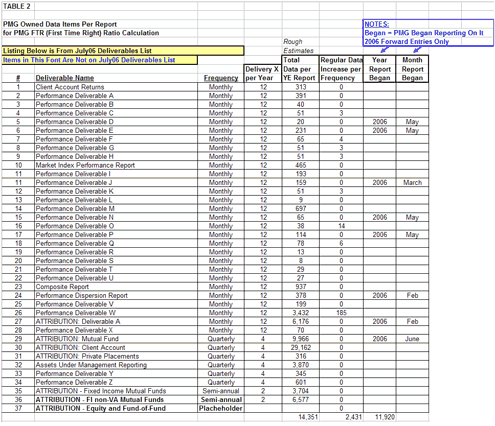
unique number of reports regularly delivered and count up the number of data points in each as of a year-end version of the report, indicate the frequency of each report and the increased data
points per increase in frequency. In this case, if one had a monthly report with 144 observations at year end with an increase of 12 data points per month, you can easily deduce the report had 132
data points in November, 120 in October, etc. The result for a sample department or system, achievable in 2-4 hours of dedicated time, is presented in Table 2.

Table 2 provides the primary transparency behind the FTR ratio report in Table 1. Further, as described above by example of the monthly report containing 144 year-end observations, Table 2 provides
the simple mathematical mechanics behind the total number of reports and total number of data points per month and for the cumulative six month year-to-date period in Table 1’s fifth and
sixth sections. The second key to balancing simplicity and useful accuracy is to capture errors and back them out from the total number of data points and reports to arrive at the FTR
Ratios.3 Table 3 captures and lists these errors, thereby providing the remaining transparency behind the FTR ratio report in Table 1. Table 3 provides the simple mathematical mechanics
behind the total number of reports and total number of data points restated per month and for the cumulative six month year-to-date period in Table 1’s fifth and sixth sections. Errors would
be reflected in Table 3 and the resulting FTR ratios during the original impacted period/month – to match up with the correct number of observations from which the errors originated.

Six Sigma Implications of the FTR Ratio (Including a Conversational Primer on Six Sigma)
Six Sigma is a quality assurance and control process and system whose roots come from the manufacturing industry. General Electric and Motorola are widely regarded as the champions of this process
and system. Both Motorola and General Electric have reaped profound benefits4 from Six Sigma. Six Sigma focuses on large observations and quickly conveys to the newcomer that
measuring acceptable quality levels (on large sets) by grades applied in the academic world results in unnecessary errors, a false sense of accomplishment, and a lack of credibility in the
marketplace. For example, regarding 99% accuracy rate as a fine accomplishment means you and your clients are perfectly comfortable with the 5,000 errors you have on a set of 500,000 data
points. If on the other hand, regarding Six Sigma quality attainment as a fine accomplishment seems more reasonable, as you and your clients would then be perfectly (or at least more so)
comfortable with the fewer than 2 errors you would have on the same 500,000 data points. Applying this gauge to large volume items such as cars or mobile phones, the reader can get the sense of the
marketplace correction an organization would experience if it were to embody the pride and sense of accomplishment of a summa cum laude graduate of an elite school (as could occur if grading
success in quality by an academic world’s yardstick) while conferring thousands of recalls of their products and a resulting, possibly litigious throng of angry, injured (or both) consumers.
As one can see, Six Sigma has clear real and opportunity cost-mitigating benefits which promulgate its continued and extended use.
If you haven’t heard of Six Sigma, or been successful in dodging it, it is probably due to some folks finding the concept and/or the process scary. I can help on both those fronts – but
you’re going to feel a pinch. Those that find the concept scary tend to be stuck in the disbelief that an organization or system cannot consistently achieve 99% or greater accuracy. Breyfogle
(2001) confronts this by specific examples (and perhaps ones chosen for effect). Breyfogle cites if 99.9% accuracy was applied to various service industries, two plane crashes would occur per day
at O’Hare International Airport, and per year each person would have 32,000 missed heartbeats. The silver lining in these bracing examples is that we are ostensibly consistently able, and
thankfully so, to exceed these accuracy thresholds (or “yields” in Six Sigma jargon). Once over the conceptual scary hurdle, the process scary hurdle follows. In a full rollout of Six
Sigma, and virtually the only rollout method proposed, Six Sigma typically requires full organization buy-in, accountability and training programs, detailed – almost forensic –
measurements, and improvement and control teams/role players. The rollout can be lengthy, expensive and disruptive to your current process. My guess is you just want to know how you are doing and
that most readers wouldn’t find it useful nor have the resources to bring in a group the size of your current staff just to tell you how your current staff are doing. In that case, the goal
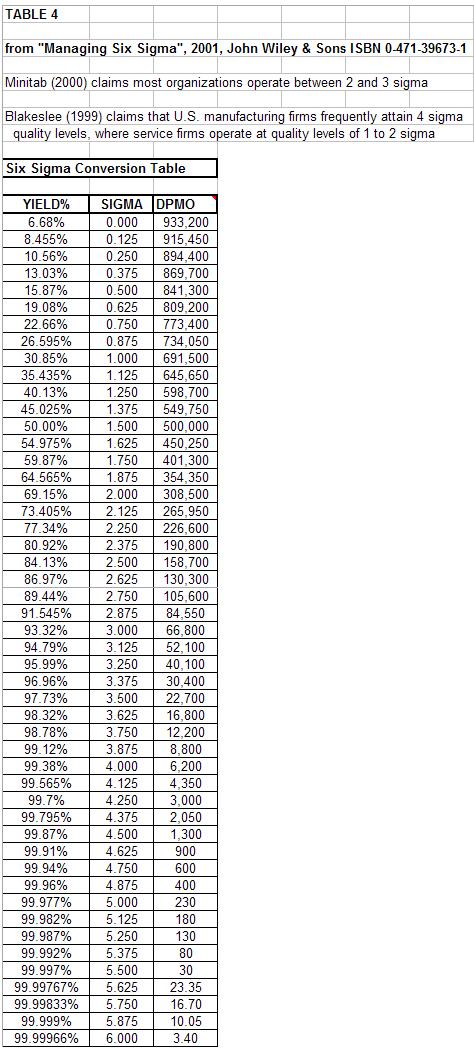
would be to convert your quality measures, say from the proposed FTR ratio report, into a Six Sigma key measurements (“yield” or DPMO: defects per million opportunities). Table 4
provides that Six Sigma conversion table from Breyfogle. Comparing Table 1’s YTD PMG FTR Data Ratio – TOTAL (Including PMG Force Majeures) of 99.9945% to Table 4, we find the department
operating at the equivalent of a 5.5 Sigma score. Per the example citations in Table 4, this Sigma score is much higher than the average organization (from the Minitab 2000 citation) and the
average manufacturing or service firm (from the Blakeslee 1999 citation).5

Comparative Data from Another Industry
From the heading, the reader may guess this section would compare the FTR ratio to the automotive industry. Though a worthy guess, as an FTR Ratio can be very informative follow up to a recall
number, such data is unfortunately, not readily available.6 Another comparison, that can fill this vacuum, and arguably more fun, is Major League Baseball’s fielding percentage.
Fielding percentage is essentially a lack of an error per opportunity, including connected opportunities. For example a third baseman fielding a ball and going “around the horn” for a
double play, without an error, would have been the first cog of an errorless 5 opportunity play.7 The FTR ratio essentially follows that same approach. The resulting FTR Ratio is;
however, inherently slightly more punishing than the fielding percentage is in baseball. This is because the FTR ratio measures the result and not the process, which the fielding
percentage does. Despite both measures reflecting connected opportunities, the FTR ratio would appear slightly more punishing as it would treat the ball (the connected data) itself as erroneous in
the 5 opportunity play example described earlier. Converting this baseball example into a performance example, having an incorrect one-month September return, for a 13-month-old portfolio, would
additionally render the year-to-date, quarterly and rolling one year and since-inception periods, including September returns, incorrect also – or all 5 return data opportunities were
incorrect.
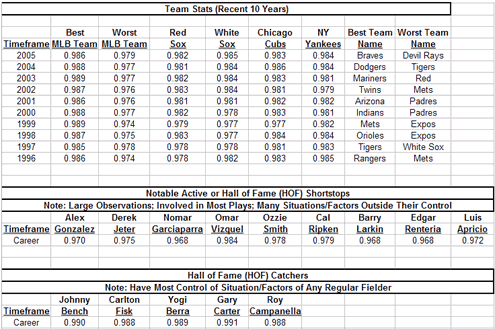
Despite its relative stunted grading of quality, fielding percentage can at least provide some, however fanciful, frame of reference. Given the current vacuum of comparative data, we’ll
proceed somewhat further, though not entirely at ease, with this frame of reference. Table 5 provides fielding percentages for select Major League teams across 10 years and career numbers for
notable or Hall of Fame shortstops and catchers. Table 5’s examples are purposeful, as they indicate a full range of success at a team level, and provide long-term reasonable targets of
success and quality based on the degree of control. With catchers having the most variables under their control (e.g., calling the pitches and the locations, etc.), the reader can arguably gauge a
best scenario approximation of long-term target measurement of quality by looking at the best catchers’ fielding percentages. Alternatively, with shortstops having the fewest variables under
their control (e.g., direction the ball is hit, degree of spin on the ball, speed the ball travels, last-second bounces, field conditions, etc.), the reader can arguably gauge a degree of
difficulty approximation of long-term target measurement of quality by looking at the best shortstops’ fielding percentages.

Extending the FTR Ratio’s Benefits
The primary and immediate benefits of the FTR ratio proposal are contained in the first six listed benefits in this article’s first section (entitled The Necessity). Each of these benefits
addresses fundamental needs of a department’s leaders. There are, however, three additional benefits we can elaborate on within this section.
The first is providing context when and if performance republishings or restatements become necessary – the 7th listed benefit in the aforementioned section. A republishing or restatement
isn’t exactly a confidence-inspiring event for either the recipient or communicator of such events, especially in a vacuum of facts or context. An FTR ratio, and in particular its
conversion to a Six Sigma equivalent score by way of yield and Table 4’s conversion table, can provide a fuller, more accurate picture of quality process and outcome within which the
restatement or republishing resides or is borne from. Accordingly, I propose a ratio such as the FTR ratio and context provider be included as a recommendation in any finalized error-correction
guidance statement or standards from the CFA Institute and other such standard-setting bodies.
The second is that the FTR ratio fits easily and firmly into the larger management tool of a balanced scorecard. A balanced scorecard is a tool to analyze a company or department on a
multidimensional scale (e.g., financial perspective, internal business perspective, innovation and learning perspective, and customer perspective) and drive for accomplishments that impact
“the bottom line” while providing an early warning system to know before “the bottom line” if things are progressing well or if a need to refocus exists in
order to hit pre-set targets. Each of these perspectives/categories are then broken down into goals and targets to measure goal achievement. The FTR ratio fits squarely in the internal business
perspective. This category, and its resulting goals and targets, captures the critical functions/processes that must perform in order for larger goals or success itself to be achieved. The
FTR ratio is certainly a candidate for the measurement tool to use in this important knowledge provider/category of a balanced scorecard.
The last of the additional benefits of the FTR ratio is the ratio is not just a tool for performance departments, nor can its benefits be only be fully realized through continuous use. It
can be used by any area dealing with large data sets that wants a quality gauge without having a disruptive effort to obtain such a gauge. The FTR ratio would be useful in accounting departments or
vendors, system departments or vendors, index or pricing vendors, small- to mid-market manufacturing firms, etc. Further, while the FTR ratio can certainly provide benefits across time, it
can also provide benefits and clarity immediately even in situational or limited use. For instance, if you expect to undertake an effort promising the realization of improved quality
(e.g., a new system or process with improved automation, etc.), you could calculate the FTR ratio before the effort to establish a baseline of results the effort would have to exceed to make the
effort worthwhile and use this baseline after the effort (optimally during the effort in the testing/prototyping phase) to see if the desired results were, or are on target to be, obtained.
Conclusion
In order to reasonably rely upon a department, system or process for vital information, one must test it for accuracy. This testing should be before and during use and reliance upon the department,
system or process’ vital output. This article introduces and proposes such a tool that is easy to set up, implement, use and interpret. This tool provides vital feedback and context to the
stakeholders and owners of this process. This tool has broad applications, immediate and long-term benefits, parallels to Six Sigma, and extensions into balanced scorecards. The proposed tool, the
FTR ratio, is particularly useful for performance measurement systems and departments – especially so in situations regarding error-correction policies, restatements and republishings.
Appendix
Formulas used in Table 1 are as follows (by YTD example):
FTR Data Ratio – TOTAL (Including Performance Group Force Majeures) –
(Total # of Data Reported – Total # of Data Restated)/Total # of Data Reported
(165,044 – 9)/165,044 = 99.9945%FTR Report Ratio – TOTAL (Including Performance Group Force Majeures) –
(Total # of Reports Delivered – Total # of Reports Restated)/Total # of Reports Delivered
(166 – 2)/166 = 98.7952%FTR Data Ratio – (Excluding Performance Group Force Majeures) –
(Total # of Data Reported – Total # of Data Restated + Total # of Data Restated Due to Performance Group Force Majeures)/Total # of Data Reported
(165,044 – 9 + 9)/165,044 = 100.0000%FTR Report Ratio – TOTAL (Excluding Performance Group Force Majeures) –
(Total # of Reports Delivered – Total # of Reports Restated + Total # of Reports Restated Due to Performance Group Force Majeures)/Total # of Reports Delivered
(166 – 2 + 2)/166 = 100.0000%
References:
Breyfogle, Forrest W. III; Cupello, James M.; Meadows, Becki, 2001, Managing Six Sigma: A Practical Guide to Understanding, Assessing and Implementing the Strategy That Yields Bottom-Line
Success, John Wiley & Sons
Kaplan, Robert S.; Norton, David P., “The Balanced Scorecard – Measures That Drive Performance,” Harvard Business Review, January-February 1992, pp. 71-79
Kaplan, Robert S.; Norton, David P., “Putting the Balanced Scorecard to Work”, Harvard Business Review, September-October 1993, pp. 134-147
Pande, Peter S.; Neuman, Robert P.; Cavanaugh, Roland R., 2000, The Six Sigma Way: How GE, Motorola and Other Top Companies Are Honing Their Performance, McGraw-Hill
End Notes:
- Force Majeures refer to events or effects that cannot be reasonably anticipated or controlled.
- By way of real world example, for absolute precision someone would need to count up all 165,044 data points for the six months in Table 1 and repeat this exercise for each new data point.
- In this regard, the FTR ratios capture known errors, thereby embodying the department’s or system’s quality assurance effectiveness.
- Breyfogle (2001) cites the following excerpts of General Electric’s Six Sigma benefits: Medical Systems had a ten-fold increase in the life of CT scanner x-ray tubes; Super-abrasives
(industrial diamond business) quadrupled its return on investment; railcar leasing reduced turnaround time at repair shops by 62%; plastics business added 300 million pounds of new capacity (saved
$400 million per year for two years). - Both these citations are contained within Breyfogle (2001).
- The U.S. National Highway Traffic Safety Administration’s search database omits number of parts per vehicle, number of vehicles produced per year per model/make, and it further lumps
impacted potential vehicle count across model year and make, all combining to render calculating an FTR ratio practically impossible for automotive production. - Opportunity 1: 3rd baseman fields the ball; Opportunity 2: 3rd baseman throws the ball to shortstop; Opportunity 3: shortstop catches the ball; Opportunity 4: shortstop
throws the ball to the 1st baseman; Opportunity 5: 1st baseman catches the ball.
Permission to Republish this Article was granted by The Spauling Group. Visit www.SpauldingGrp.com for more information.
