
While I was presenting recently at a seminar called “Data, the vital organization enabler,” I hosted a session called Information is at the Heart of ALL of the Business. During the presentation I emphasised that Data cuts across all architectural disciplines, and really is at the heart of the business.
Click to enlarge.
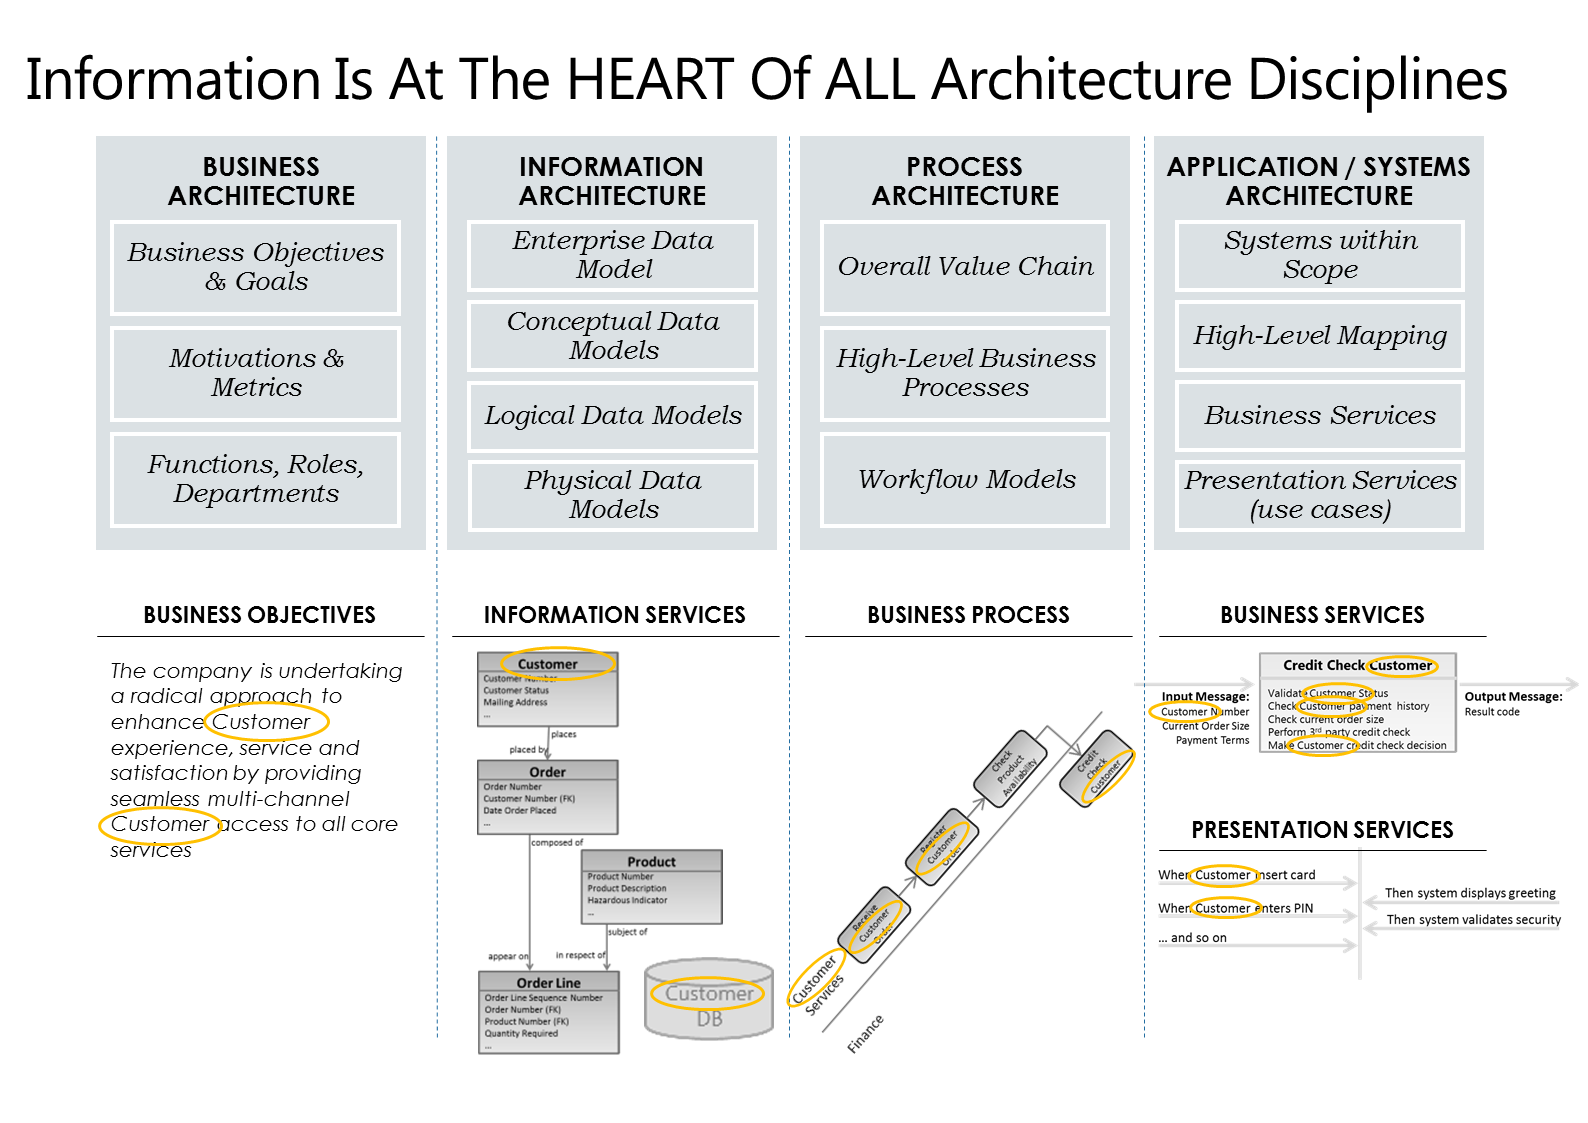
Information IS absolutely at the heart of the business. My recent white paper talks at some length about this, and the diagram here briefly illustrates four business architecture disciplines & the vital role of data in each of them.
One of the things that made me smile and prompted me to write this article was a set of conversations I had with a group of very keen, young Data Architects and representatives from a couple of modelling tools vendors that I had during the breaks.
They were saying to me, “Yes, those Data Models, and Swim lanes, and Use Case diagrams are all great and we know that stuff, but we have two big problems that we can’t represent.”
Problem 1:
They went on to explain to me,
“We need to be able to model flows of data – how do we do that”?
I hope it didn’t blurt it out loud, but I certainly thought:
“How to model Data Flows…..hmmm that’ll be Data Flow Diagrams then!”
This was one of the great features in methods like LSDM and SSADM, and the method was pretty well supported by early generation CASE tools. I still remember with some fondness how useful these were, and how we used them extensively in the 80’s and 90’s. Sure, with DFD’s there were some problems with determining how to create diagrams of the appropriate level, but TBH this was really a question of practitioner experience. Here’s a simple level one DFD:
 As the fundamental problem that was addressed by DFD’s still exists, I’m not really sure why modelling tools don’t support this anymore.
With some amusement, our conversation was then joined by a rep from a modelling tool vendor who proceeded to say how they were looking at different approaches of modelling data flow. Neither he nor the other chap had ever heard about Data Flow Diagrams, and were amazed these had dropped out of fashion.
Problem 2
I was also asked during the event:
“I’ve read your data modelling book; we know we shouldn’t create separate entities for each state an entity could be in, but how do we actually record or model the change of entity state”?
Just in case you’re not sure what this means, a simple example of state change would be how a simple (if there is such a thing) “Customer” entity.
A Suspect becomes a Prospect
Then a Prospect becomes a new Customer
Then a new Customer becomes a Gold Customer
And maybe a Customer becomes a lapsed Customer
And maybe a lapsed Customer is considered a Prospect?
… or any valid change in-between?
All these are examples of when the entity has changed its state over the history of its lifetime.
So once again, getting into the DeLorean and going “back to the future,” what do we see?
The good old Entity Life History (ELH), whose purpose is to model the transition and history or an Entity throughout its life history.
Here’s a simple example ELH for a Purchase Order:

Wow, how useful is that? You can see the changes that happen to an Entity through its life by use of an Entity Life History.
But wait, there’s more!
The approach to modelling the change of state of a Data Entity over time is both Entity Life Histories and State Transition Diagrams.
A State Transition Diagram shows the Start State, Transition Action, Transition Condition and End State. See the simple example below.

Gasps of amazement from the folks asking me the question were coupled together with a similar question that I’ve been raising; why have these gone away?
These approaches were very popular in the 80’s and 90’s but seem to have become shunned for a while and not widely supported by modelling or CASE tools.
The good news is that the need has not gone away and their importance is now being recognized again. I’ve increasingly seen these (or similar approaches) being picked up again, and in some cases being presented as a “new approach.” Like many things of the past, the “new shiny thing” isn’t always new, or indeed the best way.
The problems that DFD’s, ELH’s and State Transition Diagrams address haven’t gone away, so let’s not go throw out techniques because “they are old,” and get on with using the approaches that actually work!
Maybe it’s a case of back to the future?
