
A recent data security incident in the Police Service of Northern Ireland (PSNI) got me thinking about the idea of wicked problems and data. The data security incident was the disclosure of the names, ranks, and job assignments of every officer and civilian support staff member in the PSNI. This happened due to ‘human error’ (according to the official response).
But a human error is often the end result of a series of other systemic issues that need to be considered to help us identify the key root cause, or causes, that can help prevent the error and improve the system. This can often lead us to having to think about wicked problems in data and the people-side of data.
Defining a Wicked Problem
A “wicked problem” is a complex social or cultural challenge that is difficult or impossible to solve due to incomplete or contradictory knowledge, the number of stakeholders (and their varying opinions), the economic cost of a solution, or the interconnectedness of one problem with other problems. A key trait of a wicked problem is that it is often difficult to get a definitive scope or formulation of the problem, so it is often hard to know when to declare ‘Mission Accomplished’.
The governance and management of data in many organizations represents a “wicked problem”. There are many stakeholders. There is often incomplete knowledge, or ‘silos’ leading to contradictory knowledge or perspectives. Often turning over one data rock to solve Problem A reveals something else. And how we scope the problem we’re solving can often lead to us declaring mission accomplished at the wrong time or for the wrong mission.
For example, public sector organizations (and some private sector organizations) in many countries have obligations under Freedom of Information laws to provide information to the public on request. This is often statistical information like the average spend on widgets or the number of people at a particular grade or rank in the organisation. Organizations can often also be subject to data protection and data privacy laws that require appropriate safeguards to be in place to ensure that data relating to people is processed safely and in a manner that is respectful of and protective of other fundamental rights (this is particularly true in the EU). And finally organizations may be subject to ‘Open Data’ policies or regulations which mandate the publication of certain categories of data in an accessible form for citizen researchers or for use by other organizations.
So, we have lots of stakeholders and lots of different perspectives and requirements for what should be happening with data. Data is a Wicked Problem.
A Vignette to Illustrate
Last month the Police Service of Northern Ireland (PSNI) had a data security breach. Personal data relating to 10,000 serving officers and support staff which apparently had been held in a secure HR system fell into the hands of dissident terrorists after being published online as part of a response to a Freedom of Information Act request looking for statistical data about the police service.
Inevitably, it looks like there was a pivot table in an excel spreadsheet at the heart of this incident.
For those readers who may be unaware, Northern Ireland is a difficult place to be a police officer. It is even more so if you are a Catholic serving in a police force that, historically and into relatively recent times, was quite sectarian and biased in favour of the Protestant community in Northern Ireland. Catholic officers often don’t tell their friends or their extended family what they do for a living in case this brings a risk to their safety or the safety of their families. Addressing the historical issues of social discrimination and bias in Northern Ireland is yet another example of a ‘wicked problem’.
So, how did the terrorists get hold of this data, which included names, ranks, and details of assignments to specialist and covert units? Unfortunately the answer is ‘the PSNI gave it to them’. More accurately, the information was included in a tab in an Excel spreadsheet that was published in an online portal for FOI requests and responses. Five levels of review before the spreadsheet was published hadn’t spotted the tab with 10,000 rows of data. This data appeared online and was downloaded.
Copies of the data have now appeared stuck to walls in parts of Belfast and other cities in Northern Ireland. Police officers are concerned for the safety of their families and themselves.
While the PSNI incident is the largest, the last few days have seen other UK police forces admitting to data security breaches that are very similar. Norfolk and Suffolk police accidentally disclosed personal data of over a thousand witnesses and victims, also in response to an FOI request. In each case, a common element is the use of Excel to present statistical data in response to an FOI query.
The PSNI described the root cause of the incident as ‘human error’. Norfolk and Suffolk Constabulary identified a “technical issue” as being the root cause of the accidental disclosure of data. The fact that the incidents occurred as a result of responding to FOI requests.
Many people are asking how did this happen? How did secure and confidential data get disclosed in an Excel spreadsheet published on a public website?
A better question to start asking if we want to get the shape and measure of the ‘Wicked Problem’ is WHY.
The Importance of Asking Why
When we ask why something happened we are asking a slightly different question to the “how” question. How did this happen focuses our attention on the specifics of the immediate issue. Asking why did it happen broadens our perspective to the potentially wider issues at play and may expose the boundaries and overlaps with other problems. Taking the PSNI case as an example, we can play this out.
‘How did people unhide hidden tabs in a pivot table spreadsheet?’ (because, let’s face it, a key cause here is that statistical data seems to have been prepared in pivot tables in Excel) is a question that might lead us down a path to a solution of “we will only publish data in PDF form from now on”. And that answer might not actually be a solution because of other stakeholder requirements and needs – for example there might be a legal barrier to using locked down PDF files to publish the data.
“Why did the different levels of checking before this spreadsheet was published not catch the 10,000 rows of data?” is a good question to ask. It’s a lot better than “how did Team X or Person Y miss all that data?”. Perhaps the junior clerk who produced the pivot table actually considered the risk and had hidden the tab with the source data? That leads us to more why’s though. Like “Why did nobody think to look for hidden tabs or cells in the spreadsheet before it was published?”. Perhaps the actual root cause is a training issue in how to use Excel safely and securely for analytics and reporting purposes, or to improve training on how to audit and review spreadsheets for security risks before they are approved for release?
“Why were we preparing statistical counts of confidential data in Excel?” is a better question though. It’s a question that requires us to consider how the data got into the spreadsheet in the first place. Perhaps the PSNI HR system lacked basic reporting functionality? Perhaps there was a budget constraint on using a more secure data analysis method or tool that didn’t require raw data to be dumped into Excel and a pivot table generated? Perhaps the project to build and implement the secure HR system had never considered the requirements of the team responding to FOI requests and, as such, there wasn’t a capability available in the system to produce aggregated statistics or provide pseudonymised data dumps?
That last question gets us into talking about the data architecture of the organisation as well as the culture, training, and awareness of data issues and data-related risk in the organisation. It also has the effect of putting the discussion for why something went wrong back into the domain of senior leadership and management of the organisation (where W.Edwards Deming tells us the bulk of the root cause for defects and error should lie). It can be useful to visualise this type of analysis with a Fishbone Diagram to see how things might relate or which area of the potential problem and solution space it may be best to focus on as you start to tackle the wicked problem.
The Value of Five Whys analysis
By mapping and clustering the various “why’s” we identify, we can begin to get a sense of the size, scope, and complexities in the wicked problem. The interdependency of issues can be explored a little more objectively. And the potential gaps in controls and safeguards that have been implemented in current processes can be explored.
“Why didn’t the five levels of checks before publication spot the personal data in the spreadsheet? Because the creator of the pivot table had been trained to hide the tab for security reasons and nobody in the senior management team thought to look for hidden tabs as the people doing the checking didn’t know how to do that because they hadn’t been trained in Excel.”
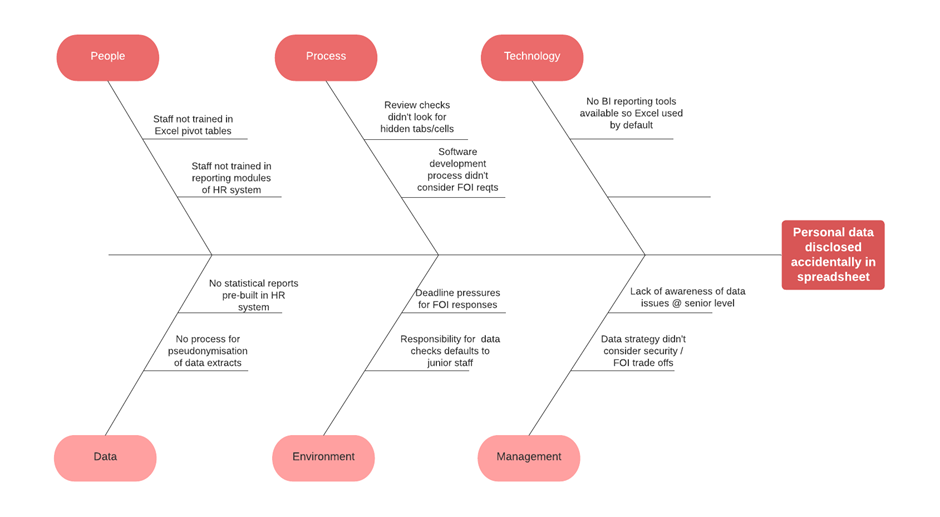
Figure 1 A basic Fishbone diagram of possible causes for PSNI data breach
The Illusion of Simple Solutions
The path to hell is often paved with good intentions. And tackling a wicked problem like balancing transparency and oversight of law enforcement operations with the need to maintain high levels of security over data relating to people (officers, victims, witnesses, support staff) can often present us with solutions that are simple, obvious, and (most importantly) probably wrong.
For example, the PSNI’s decision to only use PDF format to publish FOI responses is likely to be in breach of the UK’s Freedom of Information Act 2000. Wicked problems have many stakeholders and angles to consider.
The use of Excel by police forces to respond to FOI requests is almost certainly a result of decisions and choices that have been made historically about the design, storage, and handling of data. These ‘end-of-food chain’ processes often have to collate data from multiple sources to provide answers to queries, and they are often operating to legally defined deadlines. But often they fall foul of the technical debt and data debt elsewhere in the organisation, usually because the requirements of safe, secure, and repeatable data reporting processes outside the organisation haven’t been considered. After all, it’s only FOI request handling. What’s the worst that could happen?
Using Pivot Tables in Excel is a simple solution to the problem of how to provide data in response to FOI requests and other requests. After all, everyone in the organisation has Excel on their desktop and knows how to use it. Don’t they?
Perhaps using a business intelligence tool like PowerBI or Tableau would be a better solution? But that then raises the question of licence costs and training costs (after all, our staff might know Excel but they probably won’t know PowerBI or Tableau). And it still might not stop the risk of unauthorised disclosure of data if staff are still able to include the raw data in the output reports (that will inevitably go to Excel as a publication format).
So perhaps there needs to be consideration given to how a reporting layer can be exposed in the organisation that doesn’t provide access to the raw data to humble FOI request handlers? What if the queries related to something the organisation might need to know on a regular basis? Like how many staff were employed at what grade? A simple solution would be to create materialised views or stored procedures in the database that could produce those aggregated facts without exposing the source data. But that might not have been considered in the design of the source systems. That means budget will need to be found and, potentially, someone very senior will have to admit they signed off on not delivering that kind of security-conscious reporting requirement.
And, more often than not, that is not going to be simple.
What’s a Data Geek Gonna Do?
When considering the multiple potential simple solutions, it’s important to be able to step back and look at the bigger picture. The Fishbone Diagram helps structure our thinking and get a sense for the size, shape, and boundaries of the problem we are presented with.
Part of that process should include considering the context of the processing and the potential for risk and harm to people arising from data being disclosed or deleted in unexpected or unanticipated ways. The accidental or unauthorised disclosure of personal data published in Excel spreadsheets in response to Freedom of Information requests is a symptom of something else.
One of the things we data geeks need to do is to flag the potential risks with the simple solutions that might be put forward for complex situations or wicked problems. As data professionals we should help our colleagues and stakeholders understand potential issues and risks with ad hoc or manual processes and we should educate them on potentially better and more sustainable solutions.
It’s too late for the PSNI or Norfolk and Suffolk Police. The harm has been done, the smoke has escaped from the bottle, and police officers or victims of crime will need to deal with the consequences of their personal data being disclosed accidentally as part of a normal end-of-food chain reporting process. But we should take these kind of stories and use them as teachable moments when getting our stakeholders and project sponsors to think about the best way to implement data-related processes. Particularly in high risk environments.
The root causes discussed in this piece are largely speculation on my part. But, hopefully, dear reader, you’re thinking about your own organisation and starting to ask “What if..?”(because that’s another important question!).
What if clerical staff had had better training in using basic data productivity tools? What if the PSNI had implemented reporting using something other than Microsoft Excel Pivot tables?
What processes exist in your organisation that are ‘cheap and cheerful’ workarounds that might be contributing to a wicked problem?
