
Areas with lower household incomes appear to be more susceptible to higher levels of COVID-19 infection, according to an analysis of City of Toronto data.
The numbers show that the city’s northwest contains the highest rates of COVID-19 infections.
The neighborhoods with the top five infection rates were Weston, Humber Heights-Westmount, Glenfield-Jane Heights, York University Heights and Mount Dennis.
Each of these neighborhoods had an infection rate of over 1,500 people per 100,000 people. Weston had the highest infection rate at 1784 people per 100,000 people, as of July 16, 2020.
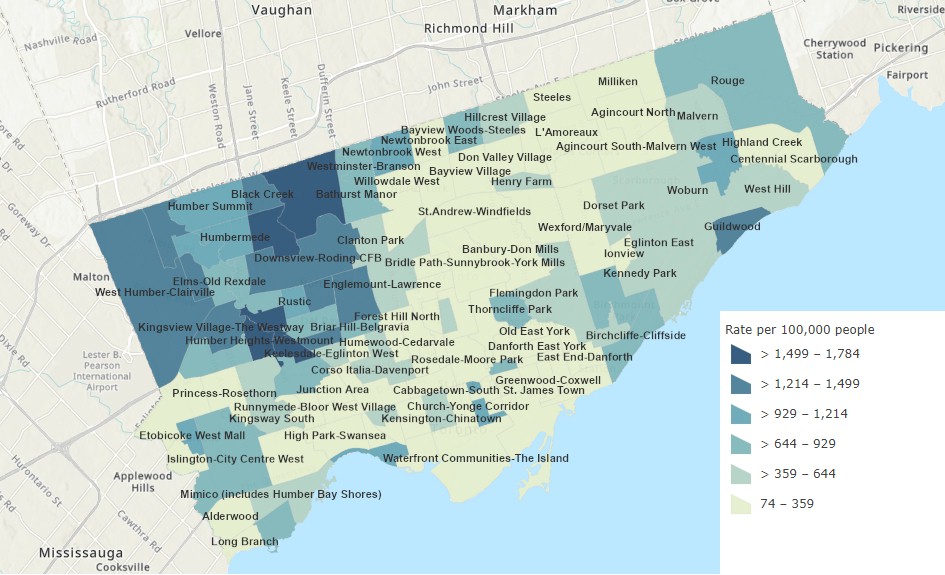
Source: City of Toronto Infographic by Neil Gonputh
Click on image to see larger version.
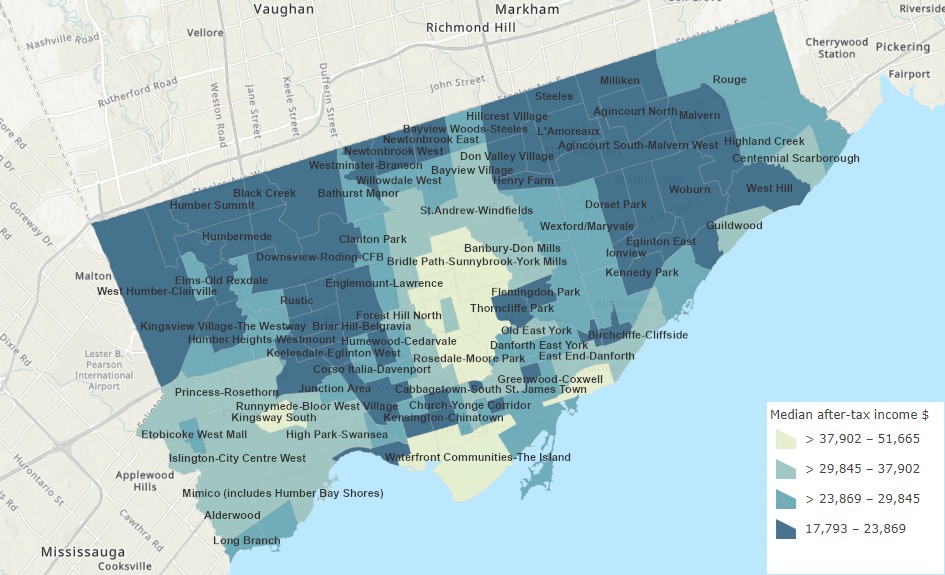
Source: City of Toronto Infographic by Neil Gonputh
Click on image to see larger version.
At the same time, some of these areas contain some of the lowest income earners in the city, with individual median after-tax income of just over $20,000, more than 25 percent lower than the city’s after-tax median income of $25,669.
By comparison, North York and the downtown core have some of the lowest rates of COVID-19 infections while containing some of the highest income earners in the city.
The neighborhoods with the lowest infection rates were The Beaches, East End-Danforth, Lawrence Park North, Willowdale East and Mount Pleasant East. Each of these neighborhoods had an infection rate of less than 120 people per 100,000 people. The Beaches had the lowest infection rate of just 74 people per 100,000 people, as of July 16.
Concurrently, the median after-tax income in some of these neighborhoods was more than double that of neighborhoods with the highest infection rates.
Those in lower income brackets appear to be at higher risk of infection. The general consensus among healthcare practitioners worldwide is that social distancing—the practice of self-isolation and staying six feet apart in public—help limit the spread of COVID-19.
But many lower income earners live in smaller, shared spaces.
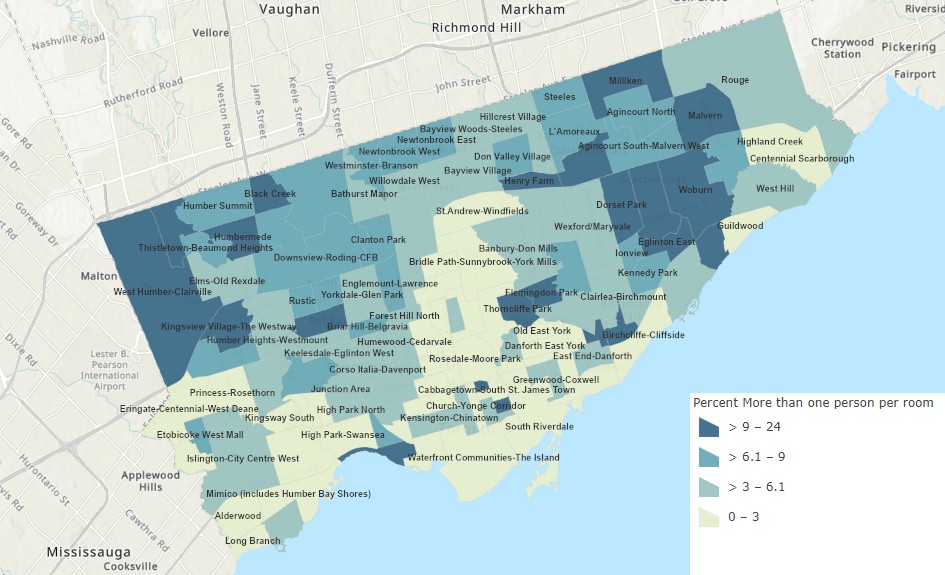
Source: City of Toronto Infographic by Neil Gonputh
Click on image to see larger version.
In Toronto, neighborhoods with a higher percentage of dwellings with more than one person per room correlate with higher infection rates.
In Thorncliffe Park, Mount Olive-Silverstone-Jamestown, Flemingdon Park, Taylor-Massey and Oakridge more than 13 percent of households have a density of more than one person per room, making it difficult to self-isolate.
In Mount Olive-Silverstone-Jamestown, more than 16 percent of the households have a room density of more than one person per room and their infection rate was one of the highest in the city at 1,453 people per 100,000 people, as of July 16.
“Money drives where people live and the people that are living in lower income brackets are just exposed to more people living closer [together] and they are exposed to more precarious situations,” said Dr. Jennifer Rayner, Director of Research and Evaluation at the Alliance for Healthier Communities, in Toronto.
By comparison, the data shows that neighborhoods with a lower percentage of dwellings with more than one person per room have experienced lower infection rates.
In The Beaches, the neighborhood with the lowest infection rate in the city, only 0.4 percent of the households had a density of more than one person per room.
“High income neighborhoods tend to have more single family dwellings and low income neighborhoods tend to have more apartment buildings,” said Dr. Stephen Hwang, Director of the MAP Centre for Urban Health Solutions at St. Michael’s Hospital in Toronto.
Living in a high-density building potentially increases one’s exposure to COVID-19 as will living in a small apartment where one cannot effectively separate or self-isolate from others, he said.
“So if there is a family of two parents and three kids living in a house and a parent has symptoms, the parent can sleep in the basement,” Dr. Hwang said. “But if you live in a two bedroom apartment it’s impossible for the person who has symptoms to effectively [self] isolate.”
Dr. Rayner shares this sentiment. “The ability to self-isolate is a luxury,” she said.
This suggests that social distancing may be difficult or impossible for lower income earners, who may also be unable to work from home, putting them at further risk of exposure.
The 2019 Toronto Employment Survey shows that the majority of jobs in Etobicoke and the west half of North York, the areas with some of the lowest income earners in the city, are in manufacturing and retail.
“People in low income neighborhoods are much more likely to work in jobs where they can’t work from home, where they work in essential jobs that require their presence in person, and that kind of work is associated with a much higher risk of exposure,” Dr. Hwang said.
By comparison, the survey also shows that in the areas of the former municipalities of Toronto, York, East York and the east end of North York, which correlate to the higher income neighborhoods in Toronto, the professional and scientific sectors dominate.
Many of these professions are office type jobs, which can be done remotely, limiting potential exposure to COVID-19.
Quantity of work may also be an issue.
“People on lower wages have to work multiple jobs to pay the bills, pay the rent and pay for food,” said Anastasia French, Campaigns and Operations Organizer for The Living Wage for Families Campaign, a Canadian organization that certifies employers who pay their staff a living wage.
“With things like COVID-19, that puts them at increased risk when they are working in three different locations and therefore putting themselves at risk—three times more likely to potentially get the disease or spread it to other people,” she said.
However, the trend of low-income workers being susceptible to illness may not be unique to COVID-19.
“Income is definitely what we call a determinant of health,” Dr. Rayner said. “If you look at all sorts of diseases, there is an income gradient and people with lower income levels or less education, all sorts of social determinants of health, impact the person’s health status.”
French pointed out some of the factors that make a low-income worker more susceptible to illness. These include more stressful jobs or jobs that are riskier to their health and the fact that low-income workers may not have the capacity to take time off work if they are sick.
Despite the correlation between low-income earners and COVID-19 infections, high-income earners are not in the clear.
A recent study of the 1918 influenza pandemic, which infected over 500 million worldwide and killed over 50 million, shows that while the illness struck the poor first, the rich had the highest morbidity in the second wave. The study suggests that differences in exposure might be the reason for the crossover in morbidity between the rich and poor.
In the summer, many of the rich may have been away on holiday and not exposed to the illness. So when the second wave came in the fall, they had never developed any immunity, while the poor, who had greater exposure in the first wave, may have developed some immunity for the second, the study suggests.
If the COVID-19 pandemic is similar to the influenza pandemic of 1918—and the data already shows that the poor are having higher exposure and infection rates—it is possible that the higher income areas of Toronto will face higher infection rates in the second wave of COVID-19.
“People who have low income are at a substantial disadvantage in almost every regard,” Dr. Hwang said. “With every disease, it typically affects low-income people more than higher income people. It’s a systemic disadvantage that we should not be surprised is apparent with COVID as well.”
Research Methodology
In looking at income data, the median was chosen rather than the average. Toronto is known as a commuter city and it is not uncommon for people to live in a poorer neighborhood and commute to a well-paying job in another neighborhood. As a result, the average might give an inflated or higher than expected value, skewing the results. So median income was more accurate in this case.
In looking at income, individual income was chosen rather than family or household income. It is not uncommon for many generations to share lodgings in Toronto. Nor is uncommon for homeowners to rent out rooms or basements. So if looking at household or family income, it would be unclear as to how many individuals are contributing to that number. As a result, individual income was chosen, as it appeared to be a uniform and unbiased way to look at income.
In looking at room density, intervals of approximately 3 per cent were chosen. However, the last interval was 15 percent. There were so few areas in the final range that breaking them into an additional five intervals added nothing to the analysis. Therefore, this 15 per cent interval was grouped together.
In looking at income and room density data, the most recent years available were 2010/2011. While census data has been collected for 2016, information from Statistics Canada needs to be converted to Toronto’s 140 neighborhoods, (Statistics Canada does not subdivide the data with that level of granularity). At the time of writing this article, the 2010/2011 median income data was the most recently available by the City of Toronto, as the 2016 median data was not yet available.
As the City did not yet have the data to compute the median values for the 2016 years, any attempts by us to compute them ourselves would require different data or methods than those used by the City for past years. In such a case, our computed values for 2016 would be incomparable to previous years’ data computed by the City and could potentially skew the data. To maintain uniformity across all years we used the City’s most recently available median data, which was 2010/2011.
This article was made possible thanks to Humber College’s Institute for Design-Driven Analytics. The IDDA trains students using an interdisciplinary approach combining design, data analytics and knowledge dissemination that provides them with the requisite skills for an increasingly data-driven world.
