
In the previous article, we looked at two age-old problems facing the IT world. The first related to an issue that is well-recognized but rarely well-addressed, namely bridging the gap between the “business” and IT. The second related to trying to balance big-picture idealistic thinking with pragmatic delivery of short-term solutions that often create silos with so-called technical debt.
From this doom-and-gloom starting point, we started to look at what we could learn from the mature practices of “town planning” for cities and see what we might be able to apply to the creation of data town plans.
A Sneak Peek at a “Data Town Plan”
I’ve talked about town planning for data. It would be very reasonable of you to ask for a bit of an idea as to what a data town plan might look like. I’ll issue a little warning before I jump into sharing some snippets from a data town plan. Many will (quite rightly) say, “Hey John, isn’t that just a data model?” Well, yes, but it isn’t quite that simple. Please read on. But first, let’s look at some samples.
I did some work for a water utility. An oversimplified view of how the business folk saw their organization’s data follows.
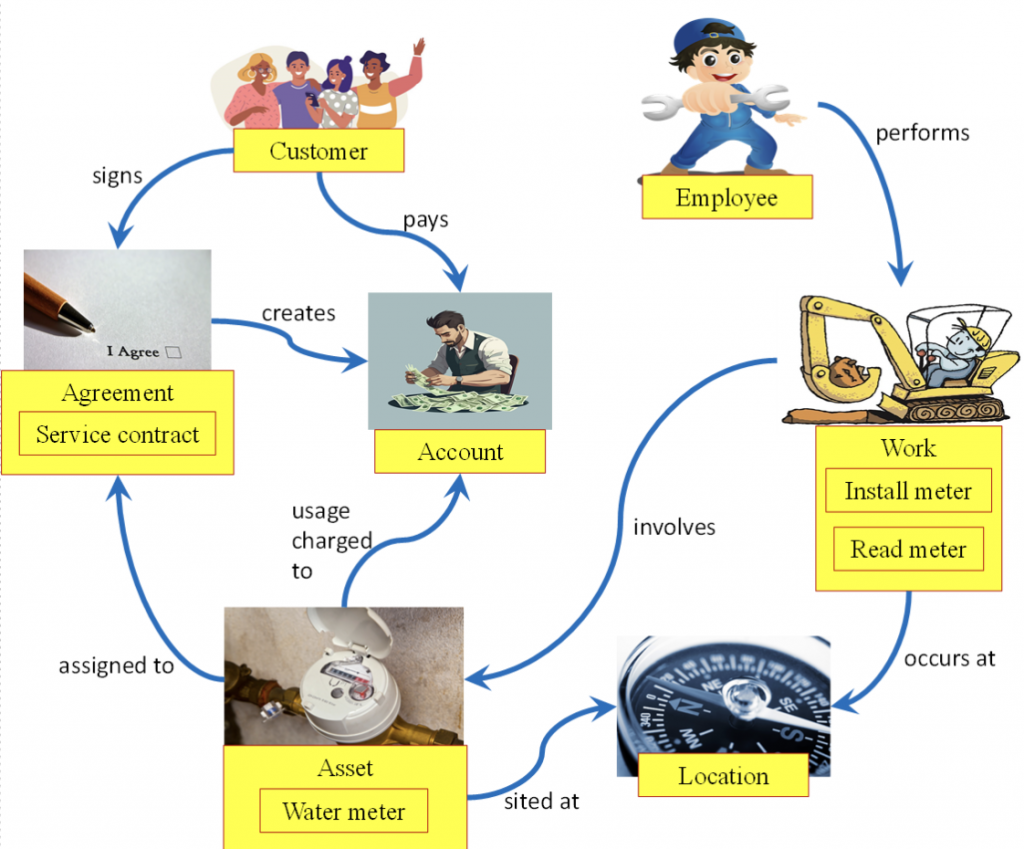
Without going into detail, let’s quickly look at some of the jigsaw puzzle pieces. Employees perform work. The subtypes of work include installing water meters at a given location and also reading water meters. You get the feel for this pretty easily? So do non-technical business managers, especially since they are key players in assembling the view of how they want everyone to see their data.
That’s the model-on-a-page. That overly simplified model contains hints of a hierarchy that classifies types of business concepts. We looked at subtypes of “work” (installing and reading meters). In this example, the “asset” concept has just one subtype, the water meters. In another real-life example related to the assets used for responding to wildfire emergencies, the asset concept had 200 subtypes nested in a hierarchy. For example, the subtype of vehicle included land vehicles and aircraft, and the subtype of aircraft had fixed-wing aircraft and helicopters. The more technical readers may call these classification hierarchies “taxonomies” (or inheritance hierarchies, or data model supertypes and subtypes, or…). The business cares less about what we call them as long as they describe what the business sees as important.
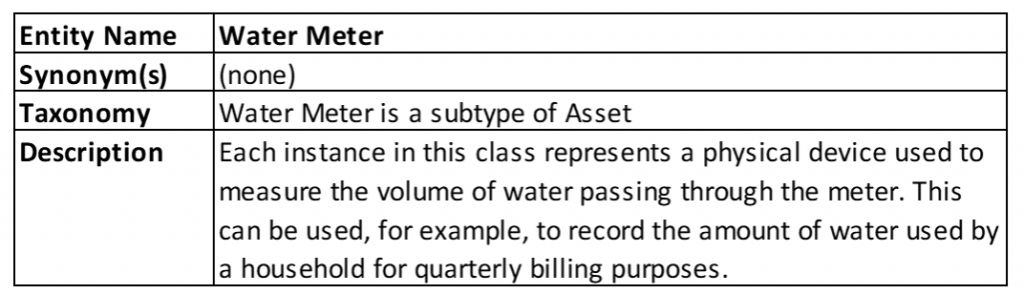
And then we capture details. Our water meter might be described like this:
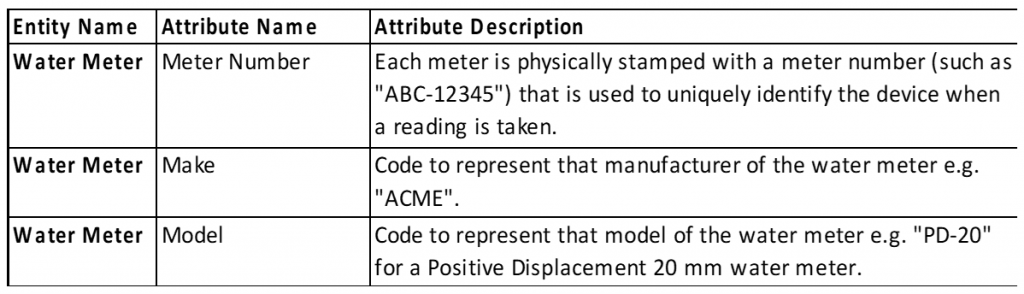
… and its attributes could include:
… plus some relationships with other things of interest to the business:
- Each water meter must be sited at one location
- Each location may be the site for many water meters.
Yes, these sorts of details do reflect a “data model,” but we can make the business people more comfortable by focusing on what they want to capture, and staying away from terms like “cardinality,” “optionality,” and “referential integrity,” let alone Boyce-Codd Normal Form!
A Framework for Creating a Data Town Plan
We’ve touched on one form of drill-down, starting with the single model on a page, then capturing more detail about the elements on that diagram.
There’s another type of drill down, and it relates to whose view we capture. Does the data town plan reflect one business group (Manufacturing, Finance, Human Resources, etc.), or all? Does it represent one business function, or all? Does it represent one business process, or all? Does it represent head office, or all countries? Does it aim to address one worrisome pain point, or all major issues? And more.
The simple answer is that it aims to embrace all significant views, but just lightly. It is a town plan, after all, and doesn’t include engineering details. David Hay published a book on buzzwords in the IT industry. A tiny snippet from his book talks of three levels:
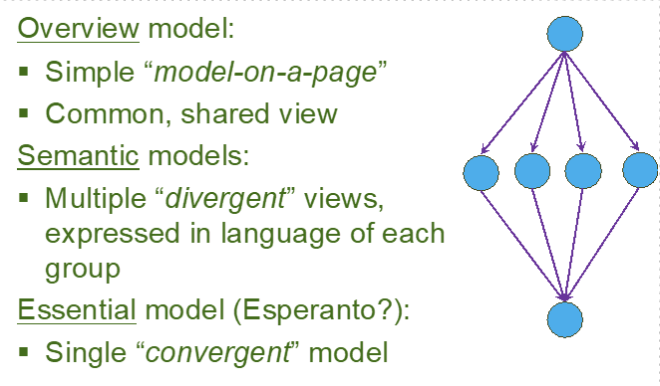
The overview model (that I’ve called the model-on-a-page) is a good starting point for a data town plan. It reflects what a representative group from across the organisation might see as being at least a somewhat shared view amongst diverse groups. Then numerous divergent views are generated to reflect the “semantics” of slices through the organization, each expressed in their own words. Then comes the challenging (and fun) bit – creation of a single convergent view. I liken it to the use of Esperanto — a language created to (ideally) allow everyone to speak their native tongue plus one other language and communicate with anyone in the world. We have a similar goal — to develop a data town plan that allows all parts of the business to retain their own data “language” while agreeing on a common framework for data sharing.
Some Stories
Black Saturday
In Australia, Black Friday wasn’t historically a day of shopping discounts from retailers. Instead, it is a dark memory from my parents’ era of a day when wildfires killed many people. Then there are other days from my personal history, including Ash Wednesday when I feared my family had died but there was absolutely nothing I could do.
That’s personal. Then there’s Black Saturday, which again had personal impacts, but also professional implications for me.
As background, there was an investigation into the fires to see what could be learned. One story that came out related to enquiries on how many “fire trucks” were in a particular location. One agency involved said they didn’t have fire trucks, they had “appliances” — their preferred name. The person trying to see how many fire trucks might be available turned to a second agency, and asked, with a note of frustration, “How many fire trucks, or ‘appliances,’ do you have?” The answer? “Neither. We have tankers and slip-ons — which do you mean?” (Slip-ons is their name for smaller vehicles with a pump-and-spray unit “slipped on”).
The exasperated worker said something like, “I don’t care what you call them. How many vehicles that can squirt water do you have?”
In anything other than a life-and-death setting, that story might be funny. But it did highlight the need for a common language amongst participating agencies, for both human-to-human communication, and for IT system-to-system communication. I was engaged to develop a common information model (a data town plan, if you prefer). The initial framework was created in a few weeks.
A Bank
There are plenty of stories I could tell of other organizations that needed a data town plan. Again and again, they got sufficient detail, often in two, three, or four weeks. But let’s have some fun with an extreme.
A bank was in the middle of a business process reengineering (BPR) exercise — you may remember that BPR was the rage a few decades ago? They hit a roadblock and realized that they needed a “data” solution before the “process” initiative could progress. I was asked to develop a data town plan for the entire organization, with detailed drill-down into one particular area, and was given one day to do it.
I leveraged Len Silverston’s patterns for banking and delivered hand-drawn images from whiteboards. In 8 hours! (But I did take another few weeks to come back and more formally research and document the data town plan).
The message is simple: You don’t need months or years to develop enough of a data town plan to deliver initial value. You might polish and refine it over time, but even then, the effort should be minimal.
Final (But Important) Comments
Our local news told the story of a landowner who was the victim of a potentially costly mistake. He’d paid an organisation to move an existing house from a proposed development site and relocate it on his vacant land, with some transformations.
The only problem was the company delivered it to the neighbor’s vacant block! (There could have been lots of nasty legal battles, but the neighbors reached an amicable agreement — they swapped land titles.)
But what on earth does that have to do with data? Let’s take a simple example. Let’s imagine you’ve got a data warehouse. One important element relates to “customers.” But the people responsible for lifting, shifting, and relocating customer data from multiple source systems deliver the wrong data to the wrong place. There’s data in the “customer” element that doesn’t belong there, and there’s data that should be there but isn’t. Something as simple as a count of customers will not deliver the answers the business needs. We need the business to participate in defining their data town plan to articulate what goes where.
Could confusion as to what data to load into “customer” even happen? Consider two real-life stories. The first is a health insurance organisation. In one scenario, a grandparent is paying the insurance premium, a parent is bringing their child to the dentist, and the child is sitting in the dentist’s chair. Which one of the three is the “customer”? If we can’t answer that, we can’t load the right data to the right location. Or a similar story for a cemetery. The original customer bought a funeral plan. Later, they had a power-of-attorney act for them as they were losing mental abilities to make decisions. Then they died. Was the dead person still the customer? Tricky questions that we need to answer rather than getting the data engineers to load data to where they hope it is to go.
Now, here’s some good news. If we have created a data town plan, it can not only help in building a data warehouse (like is the stories above), but it can contribute to many other IT initiatives. A sample list could include benchmarking candidate software packages against the business target or rolling out a master data management solution. Or maybe you want to invest in defining data structures of interoperability across multiple stakeholders (suppliers, consumers …)? What about if IT is keen to deliver data fabric (or data mesh) solutions? Or articulate the end-state vision for some strategic planning? The list goes on and on.
… and the really good news? If all of these initiatives leverage off the same data town plan, the effort in achieving data sharing is much less.
My new book, “The Data Elephant in the Board Room: Driving Data Integration from the Enterprise-wide Data Town Plan,” provides “how to” guidelines to facilitate the launch of a Data Town Plan for your business. The “business” people get to articulate their vision, and with that as a foundation, IT is better placed to deliver business value.
In summary, data town plans should:
- Be assembled top-down. The big picture is essential. We can tackle details such as data field lengths (or, in the case of the actual town, consider its town hall’s kitchen tile colours) later.
- Be based on trustworthy patterns, be they for “customer” or “product” data structures (or for the town, patterns for universities and hospitals). These high-level patterns are implementable and extensible.
- Embrace “systems thinking” to ensure that the pattern-based elements work well together as an integrated whole for the enterprise (or for the city).
- Look to the future while addressing today’s needs. For the Data Town Plan, we model not just what exists, but what could be.
- Reflect the needs of the business. The Data Town Plan should not focus on technology considerations (as important as they may be).
- Last but not least, they must aid communication between all parties.
Some people shy away from vital enterprise-level initiatives because they believe they take too long, cost too much, or are simply unachievable. Data town plans shouldn’t take forever to articulate, nor cost a fortune. But their contributions should last forever (well, a long time) and save a fortune.
