
Embedded analytics is key for companies aiming to become data driven. Gartner defines embedded analytics as “a digital workplace capability where data analysis occurs within a user’s natural workflow, without the need to toggle to another application” [1].
In other words, analytics are hidden in the business processes and within existing applications. A bank advisor sees which clients to contact in her advisory tool for specific product offerings. She does not have to bother and start another application to see this list.
Similar, customers seen directly in web-shops product suggestions such as “customers who buy A, buy B”. They do not have to switch to a different app or website for getting shopping suggestions. Embedded analytics are a great investment for both customers and business users. It is also a way for data scientists to become essential for the organization – if they adapt their collaboration model.
Looking at non-embedded analytics there are two main patterns for how data scientists support the management:
- Ad-hoc analyzes for strategic decisions for the top management, e.g., when they review where to open new branches or which ones to close.
- Periodic or ad-hoc lists for daily business operations, e.g., lists with churn candidates or upselling potential for team leads or the middle management who instruct their teams how to take action.
Here, the collaboration pattern is that data scientists talk with the business and provide them directly their insights. While producing reports and lists periodically, and sending them to a business manager who assigns them to the staff is a starting point, embedded analytics can optimize this for the periodic reports. It is more efficient if a client advisor sees the customers he or she should contact when they log in into their advisory tool. This removes time-consuming manual tasks and eliminate delays in the information distribution. However, such a big step forward for becoming data-driven has implications for how data scientists collaborate with the rest of the company.
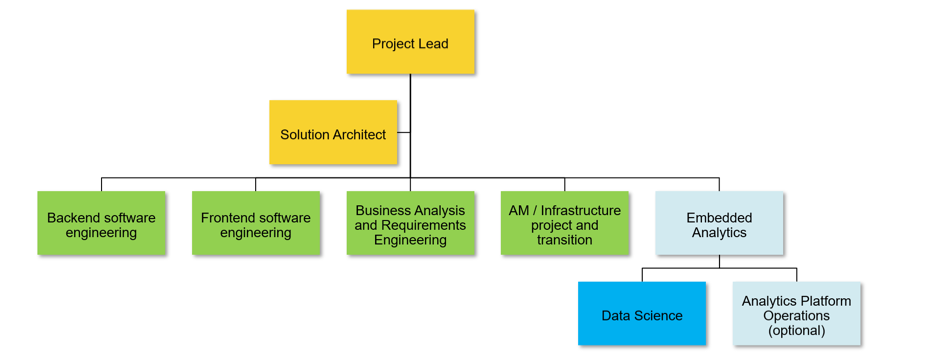
Embedded analytics means that data scientists and analytics becomes a subproject of a larger team developing, operating and maintaining an application such as an online shop (Figure 1). Thus, data scientist following the CRISP-DM methodology have to collaborate with an agile or waterfall software engineering project. This raises the question whether and how this is possible.
click image to enlarge
Figure 1: Typical project organization with a project lead plus a solution architect as a technical lead. The teams represented by blue boxes represent typical tasks such as backend and frontend engineering, business analysis and requirements, as well as application management and infrastructure services (green boxes). However, they can be organized completely differently. The dark blue box represents the data scientists. They can be the complete embedded analytics subproject or there might be a team for running an analytics platform as well (light blue boxes).
There are numerous software development methodologies such as Scrum, SAFe, or waterfall. They all structure software engineering projects, though they do this in different ways. However, all have to cover five main tasks:
- Business Analysis and Requirements Engineering is about understanding what customers want to achieve and which exact software features the future users need.
- Architecture and Software-Design, i.e., a kind of high-level blueprint which components and interfaces are needed and how they interact plus which technologies and frameworks are used for this application.
- Implementation, i.e., developing code and configuring 3rd party components to deliver the features defined in the architecture, design, requirements, and business analysis documentations.
- Testing means validating whether the implementation reflects the results of the business analysis and requirements engineering, and that the implemented features really work.
- Deployment, i.e., the installation of the newly developed software as the initial point for running the software and using it in production.
In contrast, the work of the data scientist focuses on data and analytical models. Their de-facto standard is the Cross-industry standard process for data mining (CRISP-DM) with six main phases [2]:
- Business Understanding is about making clear what the business objectives are, formulating analytics question(s), and writing down the first project plan.
- Data Understanding covers the initial collection of data sources, understanding the data, and verifying whether there might be data quality issues.
- Data Preparation covers all activities to get the final data set used for constructing the needed analytics models. Typical decisions are selecting tables, rows, and columns, to data cleansing and transforming data to get new features.
- Modeling is about constructing an analytics model using data mining and statistics methodologies.
- Evaluation is about deciding whether the constructed model is ready to be used in production. This includes verifying whether the business objects are met as well as ensuring that the overall business rules can be achieved and whether the approach and the performed steps were done correctly.
- Deployment covers all actions for using the model. This can be an implementation as well as a production of lists and reports and their usage by the business.
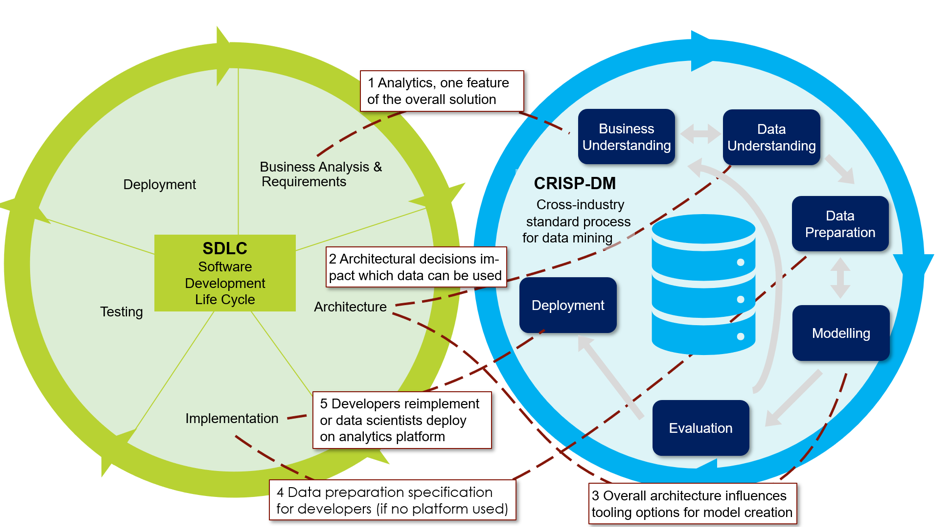
Obviously, the CRISP-DM phases and the tasks in the software development lifecycle do not match since building an analytics model and developing an application are different. A smooth coexistence within a project, however, is possible if the interaction points are clear. This is what Figure 3 illustrates and what we explain in more detail. To avoid confusion: Whether the complete application runs once through the software development lifecycle (waterfall model) or whether various features are in different phases of the model such as in case of SCRUM (e.g., a feature “report design” might be in requirements phase, whereas “analytics model for marketing” at the same time in the implementation phase), really depends on the exact methodology in use.
As illustrated in Figure 3, there are five synchronization points:
- The CRISP-DM phase “business understanding” maps directly to requirements engineering and business analysis in software engineering. Data scientists deliver the business requirements of their subproject. Obviously, at this stage, they cannot specify exactly the data they need for their analytics work and which analytics algorithm and model they use.
- The architecture and design phase of the software development project has a major impact on the data scientist and their work in the data understanding phase. It must not happen that the solution expects data feeds in production that cannot be organized on time – or not at all, e.g. due to compliance or security concerns. It is one thing to organize data once per quarter for building a model manually. It is something else to get a working data feed to a new system for delivering data on an hourly base. This requires a coordination between the data scientists and the solution architect of the software development project.
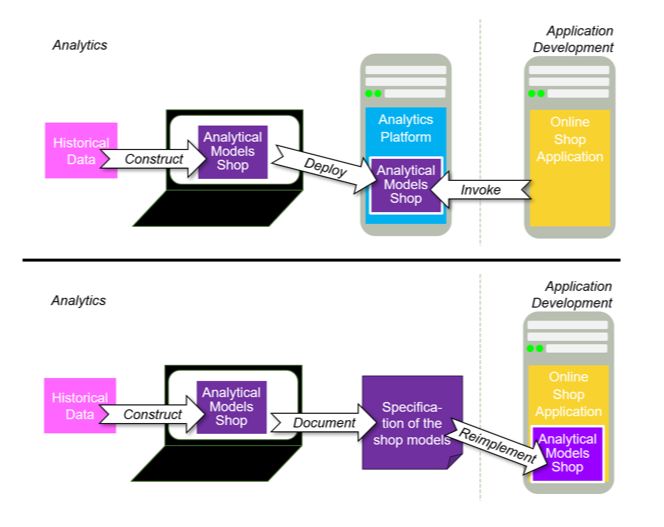
- The way analytics is integrated has to be defined in the architecture phase of the software development project as well. The central question is how data scientists provide their analytics models. Does their deliverable consist “just” of some formulas and then the developers implemented them in the application, e.g. in Java? Or do data scientists implement the model by themselves including all feeds, e.g., using an analytics platform such as R-Server? (Figure 3). Obviously, this influences which tools the data scientists can use for creating the model in the modelling phase of CRISP-DM.
click image to enlarge
- When the data scientists do not implement the data feeds and data preparation in their components, they have to provide the requirements respectively to the specification for the software engineering team so that they can implement it.
- The deployment is another synchronization point. If there is a platform handled by analytics staff, the release of the new feature has to be coordinated with the overall project. In case that software engineers reimplement the model in the application code, deployment now means that the models and formulas and exact parameters are handed over to the software engineering team and implemented during their implementation phase, so that the model goes live once the development project reaches the deployment phase.
click image to enlarge
Embedded analytics is a great opportunity for ambitious data scientists. It brings companies an important step forward towards becoming a data-driven company. There is just one point not to forget: software development projects and analytics projects follow different project methodologies. So, make sure that you define the synchronization points as early as possible to prevent intense, long, but unnecessary methodology battles in your projects.
[1] Gartner Information Technology Glossary https://www.gartner.com/en/information-technology/glossary/embedded-analytics, last retrieved December 17th, 2019
[2] R. Wirth, J. Hipp, “CRISP-DM: Towards a Standard Process Model for Data Mining”, 4th Int. Conf. on the Practical Application of Knowledge Discovery and Data Mining, April 11th-13thl 2000, Manchester, UK
