In part one of “Metadata Governance: An Outline for Success,” I discussed the steps required to implement a successful data governance environment, what data to gather to populate the environment, and how to gather the data. In part two, I will discuss the “so what” aspects of data governance — that is, what types of analysis can be performed, what the analysis means, data quality, and the “if you liked this data, you’ll probably like this data” aspects of data governance.
Asset Analysis
The collection of data is meaningless without the ability to retrieve the data, analyze the data, and make decisions based on the data.
Lineage and Provenance
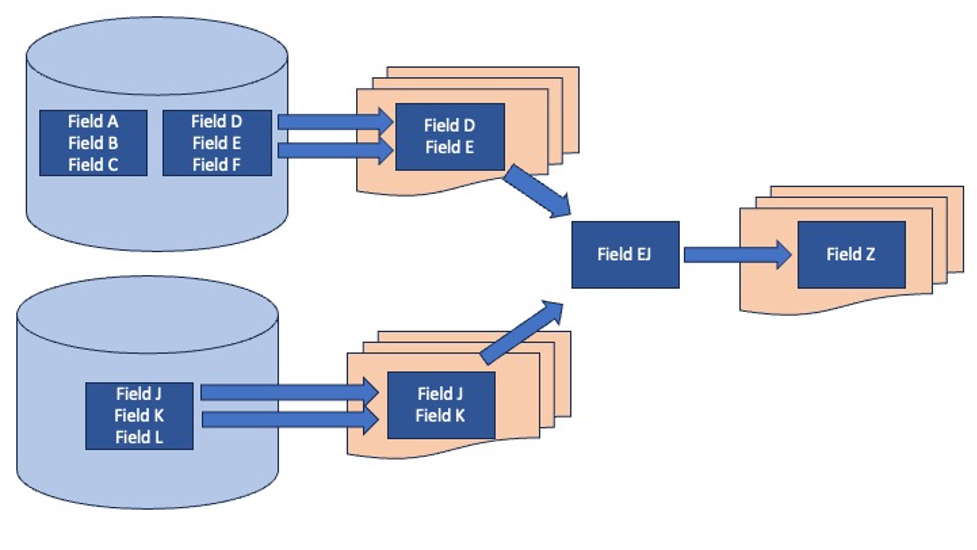
Metadata governance (MDG) provides analysts with information about the history of specific elements or reports. It shows what elements were combined, split, or otherwise manipulated, thereby providing visibility and clarity into the analysis pipeline and simplifying the process of tracing data back to their sources. In Figure 1 below, Field D and Field E are drawn from a database and are shown in reports. Similarly, Field J and Field K are drawn from a different database and are shown on a different report. Field E and Field J are merged into Field EJ and on a third report with the merged field called Field Z. The lineage and provenance diagrams provide insights into the derivation of Field Z — a type of analysis not available without the use of a customized data governance tool.

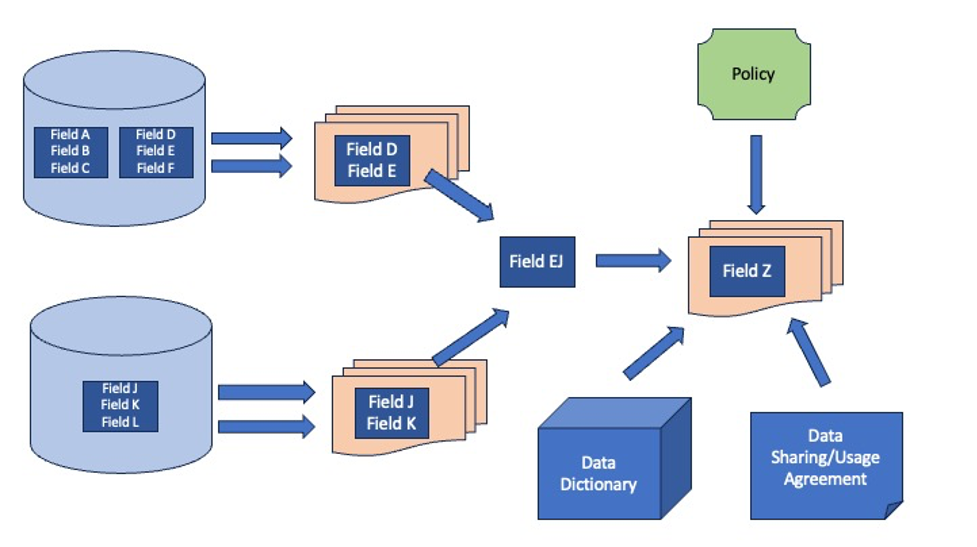
As shown in Figure 2, with the connection to Policies, Business Terms, and Data Sharing/Usage Agreements, an analyst can easily learn not only the derivation history and use of a field — as shown on the left side of the diagram — but also the governing policies, meaning, and data sharing/usage agreements for the field. The diagram can be expanded to show other fields, the systems that use the databases, the sources of Fields D, E, J, and K, the underlying technology base, etc.

By using MDG and various reports that can be produced by the tool, assets with different names, but similar meanings can quickly be identified allowing increased understanding and standardization. Just as importantly, assets with similar names, but different meanings can also be identified and resolved.
Naming and defining assets is more than a simple exercise of throwing a few words on a piece of paper — the asset name and definition must have a meaning to all users, without being overly cumbersome or vague. For example, defining “Employee” as “someone who works at the company” is vague and ambiguous. It does not address contractors — they “work at the company” — and based on the definition (from above), they are Employees, but probably not what was intended by the creator of the definition. Perhaps a better definition would have been “someone who works at the company and is paid directly by the company,” thus eliminating contractors. This is a more complete definition, but fails to address interns — are they employees?
The necessity for precise names and definitions is not restricted to business terms, but is also applicable to technological assets. Systems, databases, ETL transformations, etc., also need to be clearly named and defined to decrease the amount of time searching for assets while increasing the understanding and therefore usefulness of the asset.
As organizations grow, so does the number of assets they must maintain and understand. If an asset can’t be found easily, typically the asset is re-created, thereby doubling the storage requirements. More importantly, this results in multiple versions of the “truth” as one version is typically updated without all versions being updated. As the number of assets increases, so does the number of “truths,” usually at an exponential rate with a corresponding decrease in the ability to make correct decisions.
Data Analysis
Standardized reports can help analysts with answers to commonly asked questions, tailored to individual analysts or specialties/areas, thereby reducing the number of hours spent redundantly creating reports. Some of the types of analysis to be performed include:
- A review of the systems in place, in development, or in planning to ensure they are aligned with organizational plans. Too often, systems are being maintained or planned without being aligned with the organizational direction.
- An analysis of the systems and databases where data is currently available. As organizations grow and age, systems and databases are replicated to address specific short-term needs. Once developed, owners are reluctant to part with them, resulting in data that is duplicated, incomplete, or, in some cases, incorrect. Additionally, the same data is often created by multiple systems, resulting in a lack of clarity in terms of ownership and responsibility. As shown in the table below, there is a high correlation in data usage between System 1 and System 2, indicating an overlap in functionality.
| Field A | Field B | Field C | Field D | Field E | Field F | Field G | Field H | |
| System 1 | C | C | R | C | C | |||
| System 2 | C | C | R | C | R | |||
| System 3 | R | C | ||||||
| System 4 | D |
Table 1: System to Field Mapping
- An analysis of data flows through the various systems and databases in place. As data flows through an organization, it is often modified and/or merged with other data. Our analysis is used to point out where changes in value are made and aids users in identifying the impact of the changes.
- An analysis of the meaning of the data, from both a business and technical perspective. In order to correctly use an organization’s data, it must be understood. Simply naming a field accurately is not enough — each field must have a complete and unambiguous description. Many organizations use the same word to mean different things and use different words to describe the same thing.
- An analysis of processes and organizations. Often, processes are unnecessarily split between organizations, resulting in unnecessary paperwork (paper or electronic) and duplication of effort.
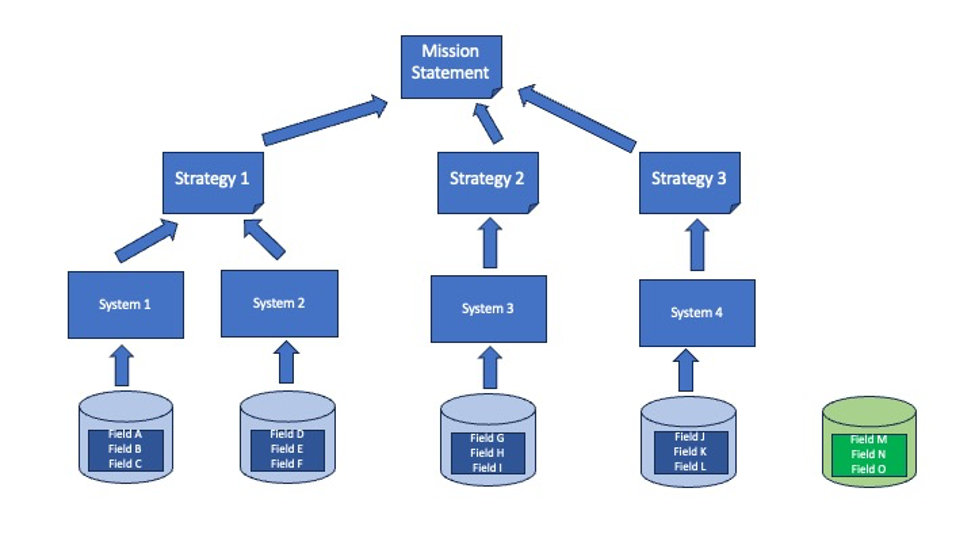
- An overall analysis of all assets. All assets identified must be traceable to providing support to the organizational mission to prevent scarce resources from being spent on irrelevant assets. As shown in the figure below, all the data fields, databases, systems, and strategies support the mission, except for the database on the far right and the fields it contains (shown in green).

Data Value Assessment
In addition to evaluating the usefulness of the data types, the actual values of the data itself must be evaluated to determine its usefulness. Usefulness is composed of several related and often contradictory criteria. For example, data that is useful to one analyst or to the analysis branch due to its summary level may not be useful to another branch for the same reason. Forecasting and trend analysis are based on summary-level data; individual “transactions” are not as important. Conversely, real-time analysis is dependent upon the lowest level “transactional”; data and summary data are not as important. Similarly, timeliness is another criterion that must be evaluated. Yesterday’s data may be appropriate for one use, while last week’s data may be appropriate for others, while in other cases, data that is hours old may not be sufficient. The accuracy of the data is the third criterion that must be evaluated. For some analysis, “close enough” is of sufficient quality. For others, exact data may be required.
Data Quality
Data quality is of utmost importance to ensure decisions are being made based on good information. Given the vast quantity of data most organizations work with, manual data quality checks and assurances are no longer sufficient. Accordingly, data analysts and data stewards must determine the minimum quality levels for key fields. The values may be a combination of the maximum number of incorrect values and the maximum number of missing values, or potentially other criteria. Rather than devoting an enormous number of resources to improving the quality of all data simultaneously, the organization must develop and implement a tiering structure to identify the most important data, followed by the second most important data, etc. Additionally, analysts need to develop and implement automated quality control measures, metrics, and graphics along with improving data quality as needed in areas that are determined to be insufficient. Quality improvements can be tracked over time by organization or other criteria to show progress over time.
Data Usage
The act of data collection for the sake of collecting data is a less-than-optimal use of human, financial, and technical resources. Part of the methodology outlined in this article is to evaluate the use of the data that has been collected to evaluate its importance. Data that is rarely or never accessed usually falls into one of several categories: not correct, not needed, or not known about.
- Data that is not correct must be fixed as soon as possible. This data may be used as a basis for decision-making. If the underlying data is faulty, the decisions that rely on that data will be faulty as well.
- Data that is not needed shouldn’t necessarily be discarded, but rather, be placed low on the priority list in terms of data that should be maintained.
- Data that is not known needs to be evaluated in order to determine the cause of its “invisibility.” The majority of the time, it’s because the asset is poorly named, but other causes include incorrect asset typing or incorrect/missing tagging of the asset.
Data Shopping and Data Suggestions
The metadata catalog can be viewed as being akin to a library catalog system. In the library, a patron can look up a book by author, title, genre, etc. Similarly, by using a data catalog, an analyst can look up assets related to topic X or all systems that use field Y. By working with analysts, standardized reports that provide answers to commonly asked questions can be developed, which then can be tailored to individual analysts or specialties/areas. These canned reports will enable analysts to save time by not having to create the same reports redundantly. Additionally, these reports can be used as a basis for new reports or creating their own reports from scratch. The use of the data catalog allows users to access data when they:
- Know exactly what they are looking for
- Know approximately what they are looking for
- Have a notion of what they are looking for
Data Retrieval (Simple Search and Retrieval)
In those cases where the user knows exactly what they are looking for and where to find it, a simple retrieval is called for. All the MDG tools allow for simple retrieval. Typically, the user merely has to enter the name of the object into the tool and it’ll be able to quickly find and present the item to the user.
Data Shopping
Data shopping refers to the concept of knowing roughly what is required or not knowing exactly where to find it. This concept is similar to “window shopping” or “just looking” in a brick-and-mortar store where the customer wanders around until the correct item is found. MDG tools provide this capability via searches and filters, which enable the user to narrow down the search. Filters often include Asset Type, Keyword, Created Date, Created By Name, or other asset-specific characteristics. The tool can also provide analysts with information about the lineage and provenance of specific elements or reports. Doing so helps provide visibility and clarity into the analysis pipeline and simplifies tracing data back to their sources. In Figure 4 below, Field D and Field E are drawn from a database and are shown in reports. Similarly, Field J and Field K are drawn from a different database and are shown on a different report. Field E and Field J are merged into Field EJ and on a third report, the merged field is called Field Z. The lineage and provenance diagrams provide the user with insights into the derivation of Field Z — a type of analysis not available without the use of a customized data governance tool.

Data Suggestions
With the significant steps taken by artificial intelligence (AI), it can now be used as a basis for making suggestions to users based on past usage (i.e., “Since you liked this data, you may also like this data”). This functionality will be based on the search pattern and usage of similar typed data by all users within the organization, not just the specific user. By using a broad spectrum of analysts’ requests, a better sample of related data items will be identified and made available to users. Over time, as usage patterns change due to the changing environment or situation, the suggestions made by the system will also change. Closeness or similarity parameters can also be adjusted to fit different situations or circumstances.
Customer Satisfaction
Measures and methods must be put in place to assess customers’ satisfaction with the data they are receiving and to gather ideas for the improvement of the data in terms of quality, timeliness, summary level, or other factors. Often, a system can be put in place that will track the frequency at which data is being used to ensure resources are devoted towards making sure the data is of the highest quality. As the frequency with which data is accessed decreases, so will the amount of time that should be allocated to ensuring the quality of the data, thereby enabling precious resources to be applied where they are most valuable. As part of the effort, users should rate the quality of the assets, enabling a quick mathematically based evaluation of the data’s usefulness. Data that is rated poorly will be evaluated to determine the cause of the rating. Depending on the cause of the low rating (e.g., incorrect value, lack of timeliness, summary level, etc.), different remediation steps will be identified and put in place.
Conclusion
Organizations must understand the relationship between their corporate missions and all of the assets that support the mission. This can best be accomplished by understanding what the assets are, what the assets mean, and how they relate to each other in support of that mission. Together, strategy, processes, data, and technology will ultimately allow an organization to achieve success.
Image used under license from Shutterstock
