 My first data valuation was performed 20 years ago. I had just joined the strategy department of a bank – having come from data warehousing where I was responsible for leveraging the bank’s data – and my first task was to propose a turnaround strategy for a pioneering online brokerage startup.
I proposed a cross-sell campaign leveraging the bank’s high net worth customers, and showed how a 0.8% campaign success rate could make the business profitable. From my data warehouse days in the bank, well-constructed cross-sell campaigns were reaching conversion rates of 10% at the time, which helped contextualize the relatively low performance required of the campaign to achieve profitability.
My bias has always been towards investment-grade valuations, having somehow always needed to show how my data investments create shareholder value. This approach may not suit everyone, but if you’re presenting a data investment to shareholders or their agents for approval, then this article may prove useful.
Key Constructs
Valuation can be complex – valuation textbooks easily reach 500+ pages. However, the complexity is often not so much about the mechanics of the valuation as it is about its content.
In terms of the subject of the valuation, much has been said about data as an asset. Contextualized, assets are fixed, current, or intangible (like data), and they may be intrinsically valuable, and/or they may create value. Data generally has intrinsic value. That’s why hackers steal it. Processed data can also create value when it is acted upon by increasing revenue, reducing costs or mitigating risk. However, organizations that see data merely in terms of its storage costs are not likely to recognize its value, and much less to see it as an asset.
Generally, valuation concerns finding the net present value (NPV) of an asset’s future net cash flows up to n periods in the future, with the emphasis on “net” and “cash flows”. “Net” concerns the difference between the cash benefits and the cash costs incurred to generate those benefits, while “Cash Flow” is about REAL DOLLARS changing hands.
Ignoring the “present value” part of NPV right now, the sum of all future cash flows of the initiative is expressed as:
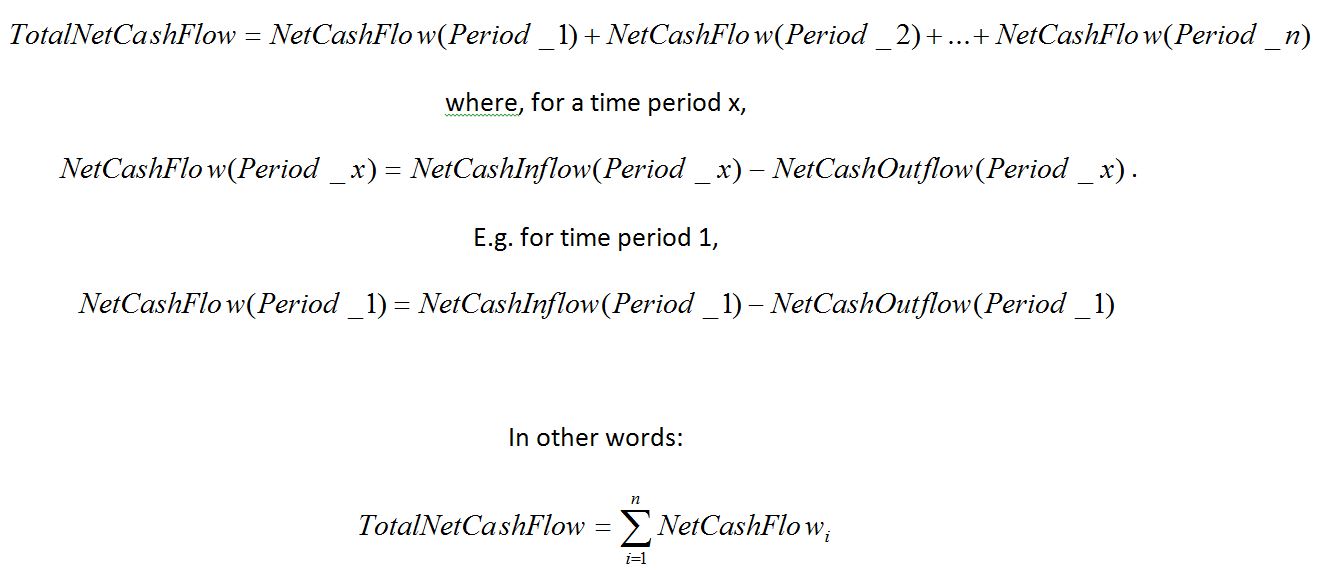
Equation 1: The Greek capital sigma is mathematical shorthand for “the sum of all”, here being the sum of all NetCashFlows between the first (i=1) and last period assessed (when i = n).
So the changes to cash flows as the result of an initiative are positive (inflows or reduced outflows) or negative (outflows). It is useful to identify and assess the positive changes to cash flow in three buckets, as reflected in Figure 1:
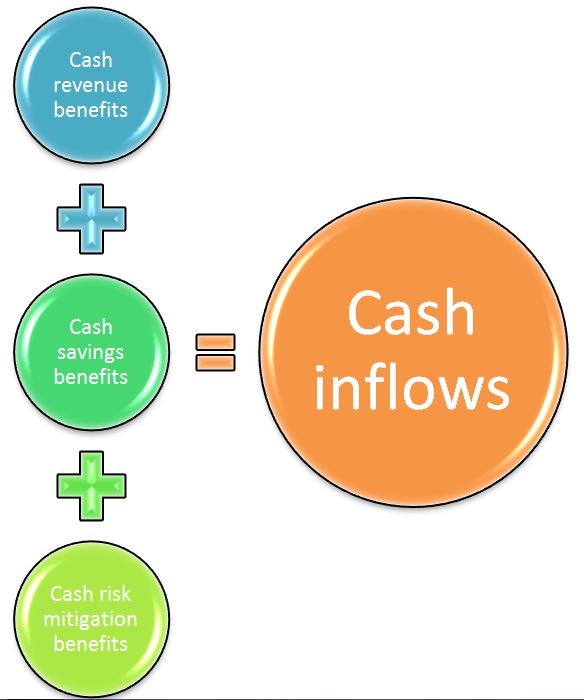
Figure 1: The three buckets of inflow benefits.
So what’s in these three buckets?
Revenue Benefits
In the 90s, we built Customer Lifetime Value (CLV) models to determine the potential future revenue flows from our customers, based on the probability that different products could be cross-sold, up-sold or re-sold to the customer. Aggregating all CLVs into a single value called Customer Equity (CE) is more meaningful for valuations though. Indeed, CE models provide a sound basis for modelling some of the benefits of data-driven initiatives. Examples of revenue benefits include new sales, cross-sells, re-sells and up-sells, all of which are typically the outcome of marketing activities (a cash outflow component).
Savings Benefits
Savings benefits accrue when there is a reduction in cash outflows as a result of the initiative. These are easier to quantify than revenue benefits, but beware of making mistakes here, such as claiming savings when there is no decrease in REAL DOLLAR expenditure. Examples of savings benefits include increases in product profitability and channel profitability due to reductions in operational costs, as well as reductions in head office costs that are usually allocated to operations.
Risk Mitigation Benefits
Risk mitigation benefits accrue when the scale of undesirable negative outcomes is reduced. For example, better quality data improves analytics quality, which is important if actions are taken on analytics outcomes. Decisions made on bad quality analytics – whether because of poor data or poor modelling – can incur risk and negatively affect the organization’s reputation and ultimately its market capitalization. It’s at this point that the Board of Directors would step in, since protecting an organization’s reputation is its top priority. Examples of risk mitigation benefits include reduced fraud, reduced regulatory penalties and reduced bad debts.
To balance the benefits, a supporting action plan – with the cash costs of implementing it articulated – positions us well to determine the net benefits of the initiative.
However, there’s much more to it than just qualifying and quantifying the costs and benefits. We must also understand the context of the valuation, with governance and accountability as guiding themes, across the following parameters:
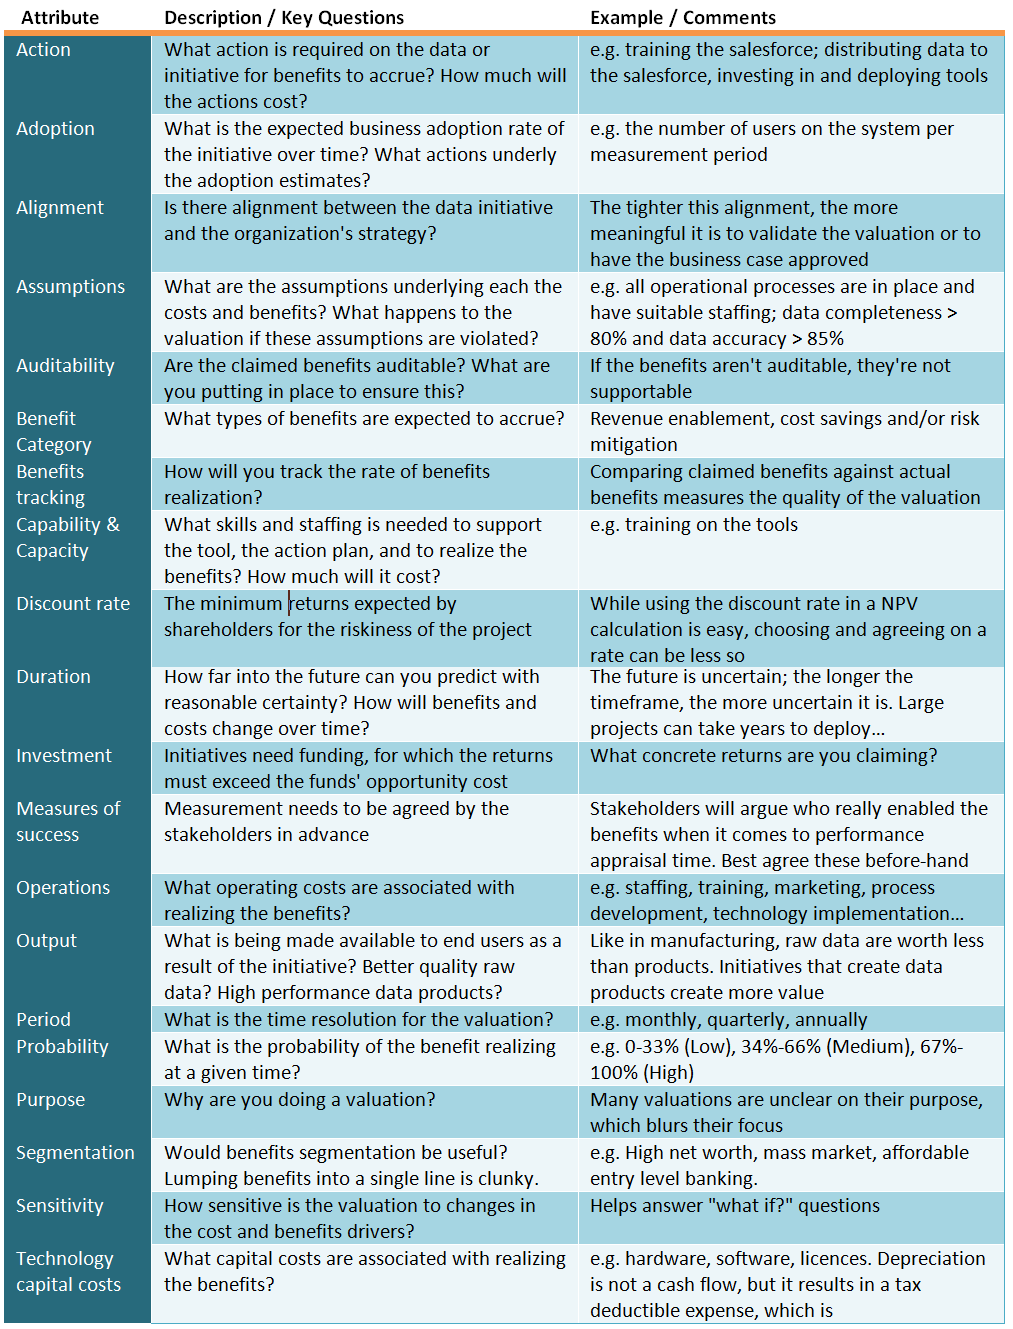
Table 1: Many different insights are needed for a sound valuation.
Building a valuation without understanding the context of the valuation, as suggested by the attributes in Table 1, means you are unable to develop as strong of an argument for value as you could be.
Data Quality as an Initiative of Interest
Data quality is a current concern for most large financial services organizations, and serves as a great example for our purposes. It’s however taken two decades for data quality to receive this attention, spurred by regulations with direct or indirect implications for data, like Basel’s BCBS 239 (RDARR), BCBS265 (FRTB), BCBS279 (CCR), MiFID II, GDPR and more.
The 1990s were the height of academic interest in data quality, and much of it is still relevant, like today’s dimensions of data quality, which were already formalized in 1996 and as shown in Figure 2:
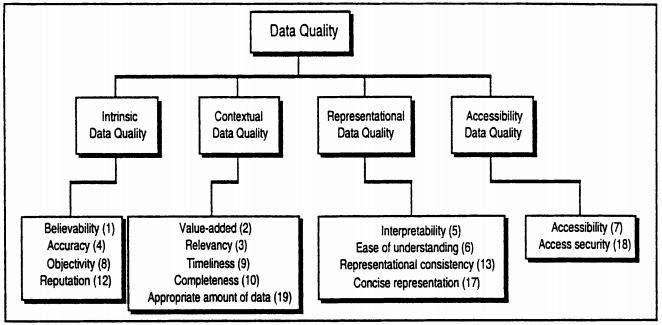
Figure 2: Dimensions of Data Quality (Wang and Strong 1996).
Data quality is our focus from here on.
The Cost of Dirty Data
Business frequently corrects poor quality data to address its negative impact on reporting and business outcomes. These activities incur costs which the introduction of e.g. data quality tools, data policies, standards, processes and tool-based training all aim to reduce or eliminate. For example, the baseline and target quality of a data element might take the form shown below:
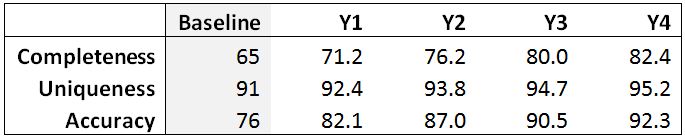
Table 2: The baseline and forecasted data quality measures for data element “Social Insurance Number (SIN)”.
Given agreed targets, good governance requires that data cleansing follows a rigorous and well-documented process, like in Figure 3. Note that the process can be vastly different for different types of organizations, systems, and data.
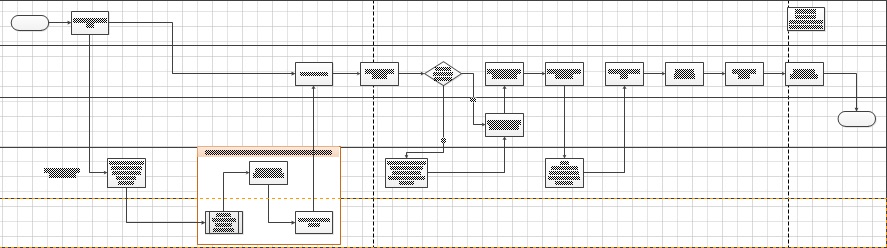
Figure 3: A conceptual data cleansing process.
The next step is to determine the cost to execute the process, costs that wouldn’t be incurred if the data was clean. If we know these costs, we know one part of the cost of dirty data.
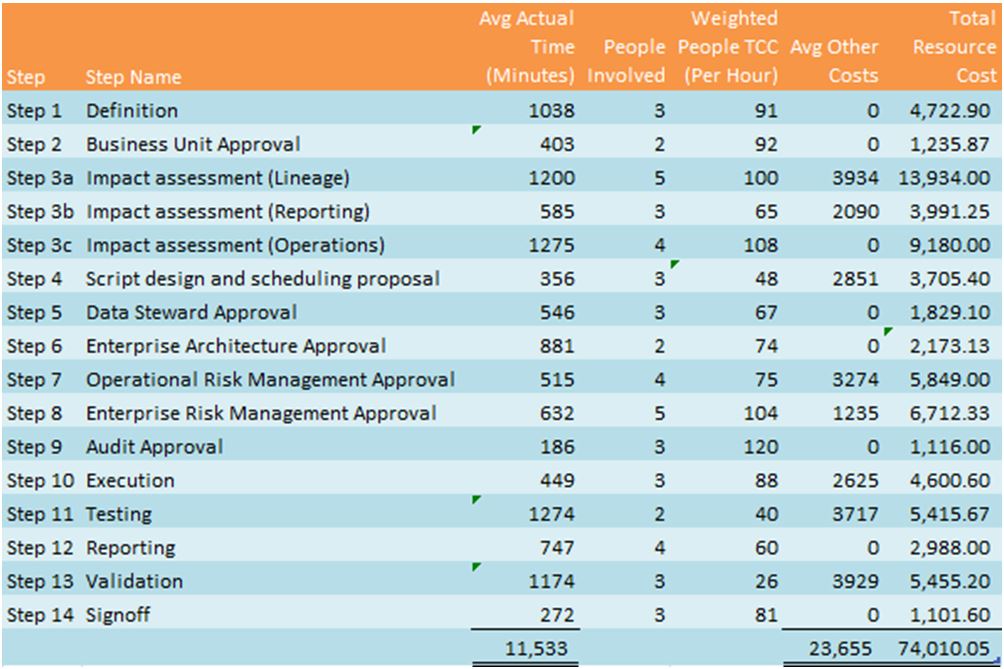
Table 3: The cost of implementing the process in Figure 3 for “SIN” is about ~$74,000, per iteration.
The total cost of dirty data is ultimately the sum of all corrective activities across the enterprise, plus the cost to the business of e.g. regulatory penalties as a result of late or poor reporting.
A goal of data quality is to reduce the cost of dirty data. The role of the valuation is to show the shareholder value added by the activity, and how the cost of dirty data to the enterprise decreases.
Bringing It All Together
With all the data gathered, now’s the time to power up the spreadsheet.
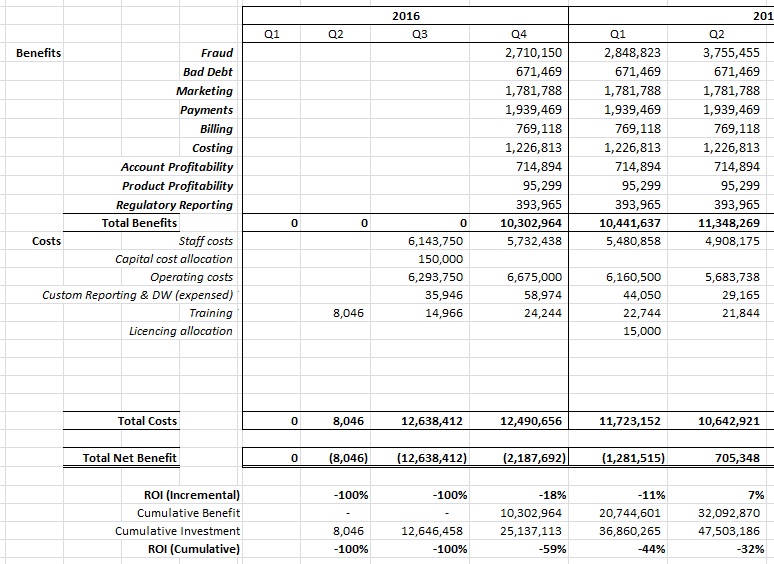
Figure 4: Mapping benefit flows against cost flows: Extract from a real case (not all periods are shown).
Note that the precision in Figure 4 is arbitrary, given that these values are forecasts. Note also that rounding should only be done after all calculations have been completed.
Determining Net Cash Flow
The net cash flow of the project is the sum of the Total Net Benefit line in Figure 4:
-$8,046 + -$12,638,412, + … + $705,348 = -$15.4 million.
So by Q2 in 2017, the project would be $15.4 million in the red. This does not necessarily mean that the project is a financial failure though – in this case, we simply haven’t performed the calculation across the full investment horizon (Figure 5 is a partial view).
Consider some other valuation metrics:
Determining Breakeven
Breakeven is the time taken for the project to return positive net cash flows. In relative terms, breakeven occurs when the period benefits exceed the period costs for the first time. This occurs in Q2 2017 (period 6 of the project), as shown by the BAR graph in Figure 5.
In absolute terms, the cumulative costs incurred up to period 5 are only balanced by cumulative benefits by period 11, as shown in the LINE graph in Figure 5. This is when the total cost of the investment is recovered, and the project becomes cash flow positive.
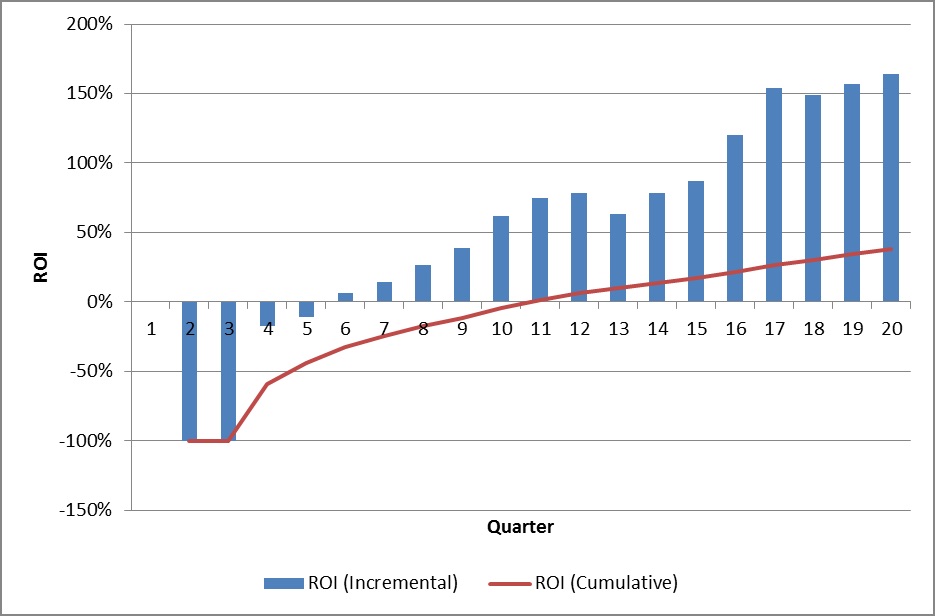
Figure 5: Relative versus absolute breakeven, based on the full scope of Figure 4.
Determine NPV
NPV calculates the value net of the cost of funds (like interest and expected returns on equity). A positive NPV means the project provides returns in excess of the minimum returns expected by shareholders, while a negative value means shareholder value is destroyed.
A fundamental parameter of an NPV calculation is the discount rate. Calculating it can be complex, so an easier way to get it is to ask your Corporate Finance department what rate they use. Doing this means one less thing to worry about when finance audits your calculation.
Now using the values in the Total Net Benefit row of Figure 4, calculate NPV using Equation 2:
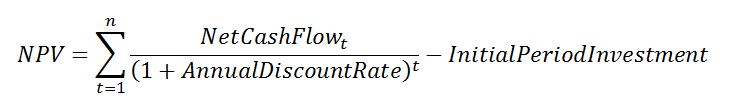
Equation 2: NPV.
Assume the annual discount rate is 10%. Depending on how far into the future your project is expected to begin, the first period net cash flows, represented by InitialPeriodInvestment in Equation 2, are not discounted.
Note that the choice of period (e.g. month, quarter, year) can increase the complexity of your calculation. For example, if you assess your cash flows in years, then this equation can be used as is. However if your cash flows are in quarters, then you would need to adjust the discount rate as per Equation 3:
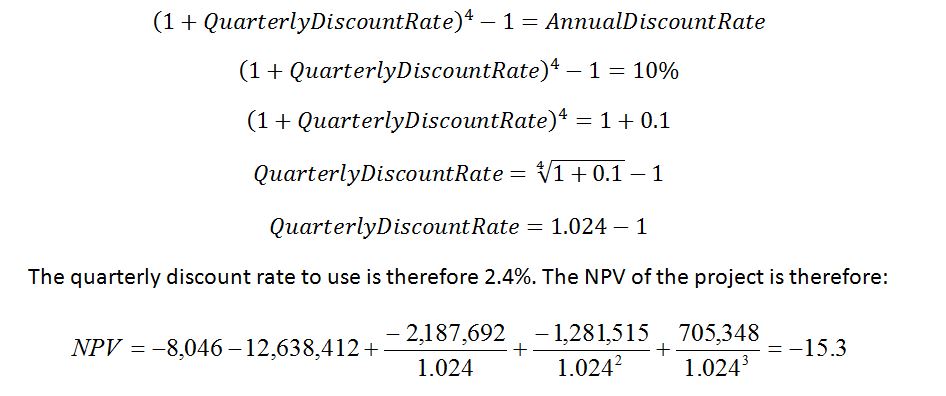
Equation 3: Calculating the quarterly discount rate to use, given an annual discount rate, and determining the NPV of the project.
From Equation 3, a NPV of -$15.3 million is interpreted by shareholders as a $15.3 million destruction of shareholder value. Whether this is satisfactory or approved by the investment committee depends on the strategy and risk appetite of the organization.
A Word on Valuation Risk
Be careful about using too long a time period to assess the project’s NPV. Choosing appropriately comes with experience and judgment, but for IT projects in general, three years after deployment is enough for many purposes. Beyond this, it gets complicated with things like technology redundancy and technology refresh cycles.
Ultimately, the quality of a valuation depends on the quality of the inputs. The inputs are estimates based on an assessment of the future, and because they are estimates, they can be higher or lower than reality would later prove them to be. The art comes in knowing how to balance various factors to arrive at a credible valuation, where the gap between valuation and reality prove to be as small as possible.
Some other risk factors to consider include:
- Being unable to show what initiatives will drive the benefits claimed for a particular period, and how they will drive them
- Not understanding the assumptions underpinning the financial model
- Not identifying all the relevant data for the valuation objective
- Not distinguishing between cash flow and non cash flow items
- Using the wrong discount rate, or using it incorrectly
- Not having sufficient data for the required analysis
- Creating a model looking too far into the future
- Making incorrect conclusions about the outcome
- Not having data of sufficient quality
- Incorrectly analyzing the data
A poor quality valuation introduces reputation risk. A poor evaluation is usually exposed during audit, or during benefits tracking. If benefits tracking is enforced, then the person accountable for achievement of the benefits could be compromised if the model and reality prove to be significantly different.
Conclusion
There are many reasons to do a valuation of a data initiative. It enables a shareholder value conversation when it comes to jostling for funds against competing initiatives, it walks the talk of the hype around the cost of dirty data or the benefits of data governance, and it shows how you added shareholder value – just in time for your performance review – thereby helping to add that all important quantitative element to your résumé. In many cases, it’s the de facto instrument to use when raising funds for almost any investment.
With a Board of Directors hat on, Directors want to know how the organization’s funds are being deployed. The more evidence there is that an initiative is well-thought through and has a sustained positive impact on shareholder value, the more positively the Board sees the initiative, and the more it continues to fund it. In fact, in an age where cost-cutting dominates the corporate landscape, those that can prove that their initiatives add sustainable shareholder value are at a significant advantage compared to those that don’t, or can’t.
References
[1] Wang, R.Y. and Strong, D.M. (1996). Beyond accuracy: what data quality means to data consumers. Journal of Management Information Systems 12, 4: 5–34
