 Often, we continuously struggle to identify the right tool for the right requirement, especially after mastering graph database terminology and being exposed to many different graph database tools.
This series of columns will focus on many things including the nature of a graph database, how we evolved to a graph database, how a graph database is different from a relational database, two classes of graph databases – property and semantic, how property and semantic graph databases differ, use cases, challenges, how to map project requirements to a graph database to identify the right choice and how to gauge the graph database tools using the SMART technique.
The first in this series will introduce the definition of a graph database and some terminology.
What is a Graph Database?
A graph database is used to navigate interconnected webs of data. It uses graph theory to store, map, and query relationships. A good application of a graph database is social networking. We will focus on several use cases in this upcoming series in detail. First, we will cover the foundation and origin of graph database.
Seven Bridges of Königsberg
A popular problem which was developed by a Swiss mathematician Leonard Euler is considered to be the first theorem of graph theory and the first true proof in the theory of networks. See Figure 1, which shows the city Konigsberg and its seven bridges that cross the river.[1]
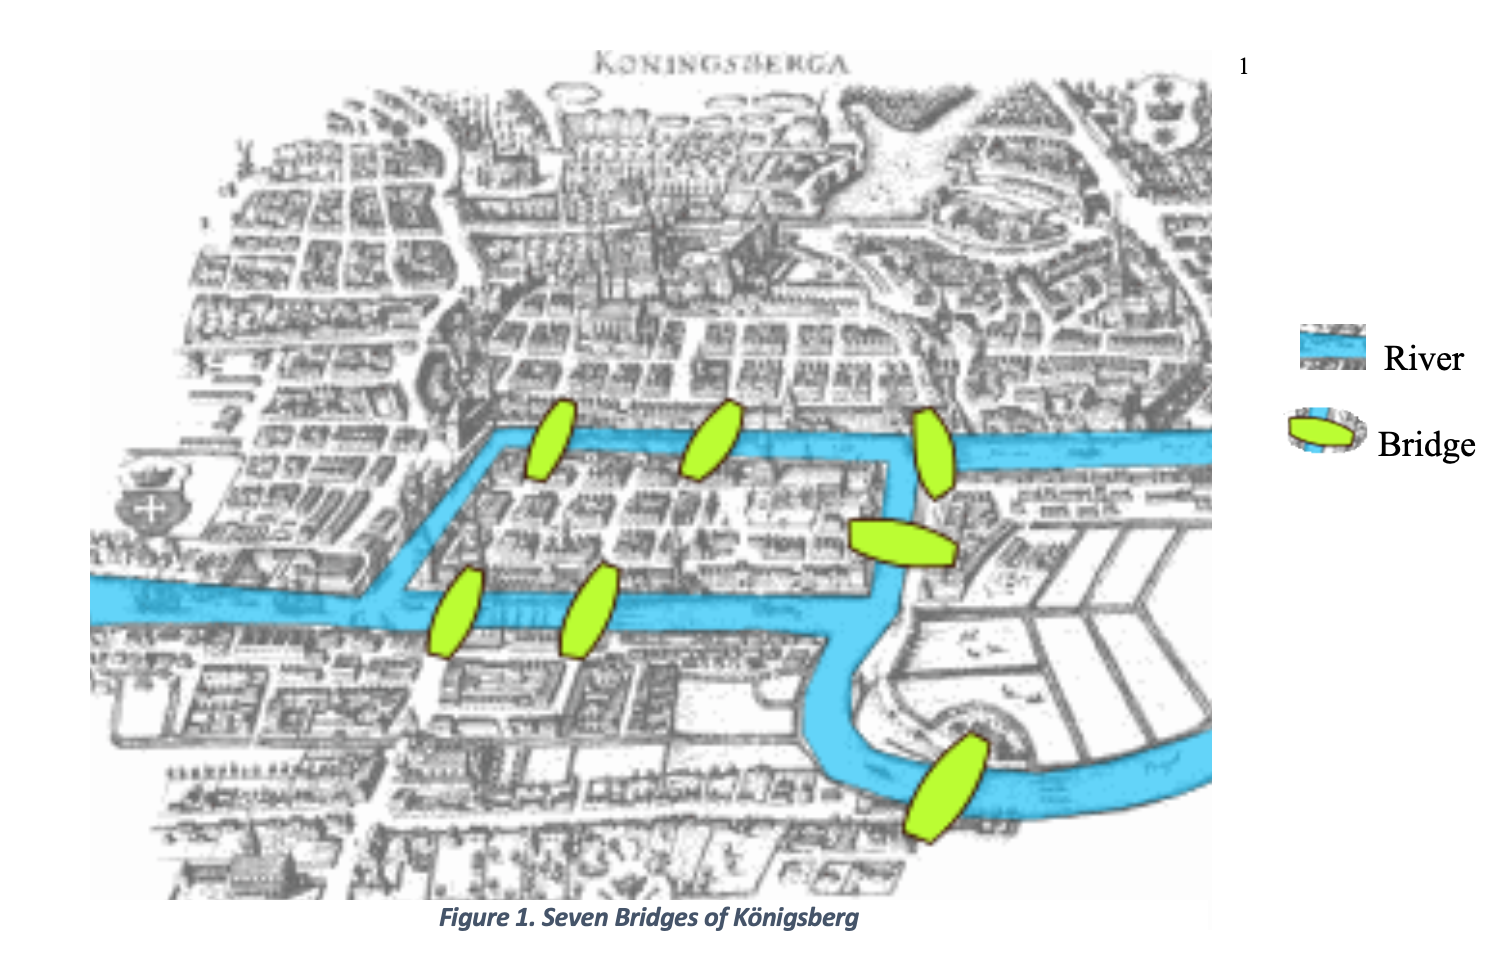
The challenge is to traverse the city crossing each bridge once and only once.
It is not possible to navigate through the city crossing the bridges only once. But Euler did find a solution using Graph Theory. The important thing is to focus on the lands and their relationships between each other. This is the fundamental aspect of graph theory. Figure 2 shows that there are 4 separate pieces of land that are separated from the other via the river. Each land is represented by a dark green dot. The problem involves navigating between each of these pieces of land by using the bridges.
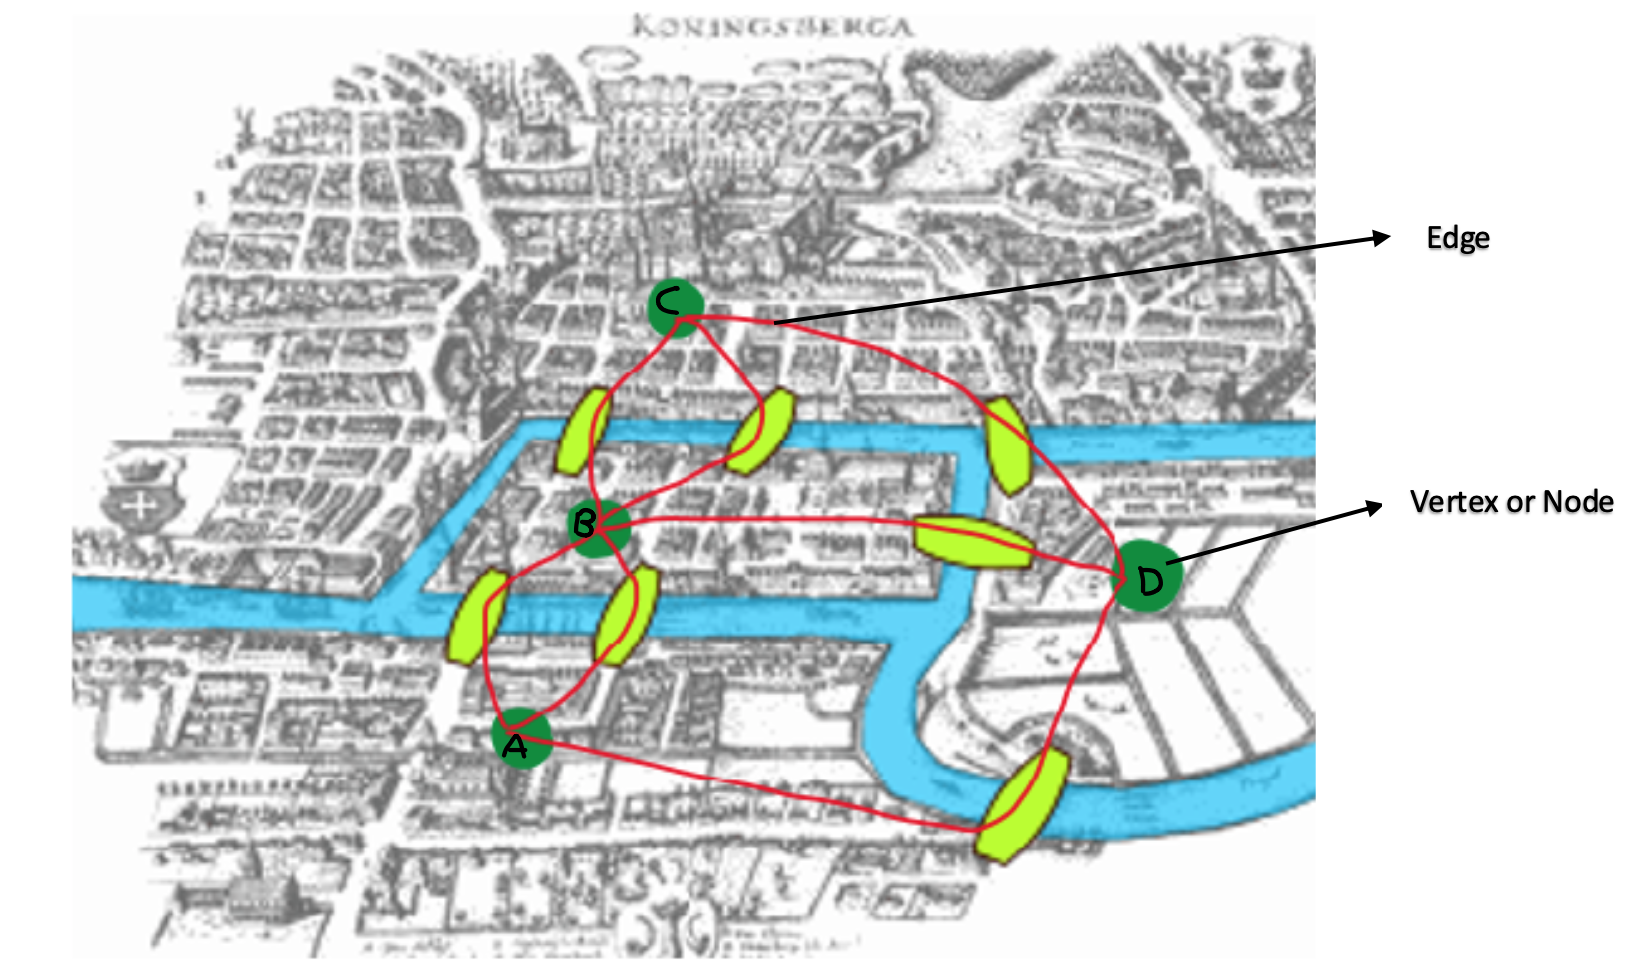
Figure 2. Seven Bridges of Königsberg with Vertices (Nodes) and Edges defined
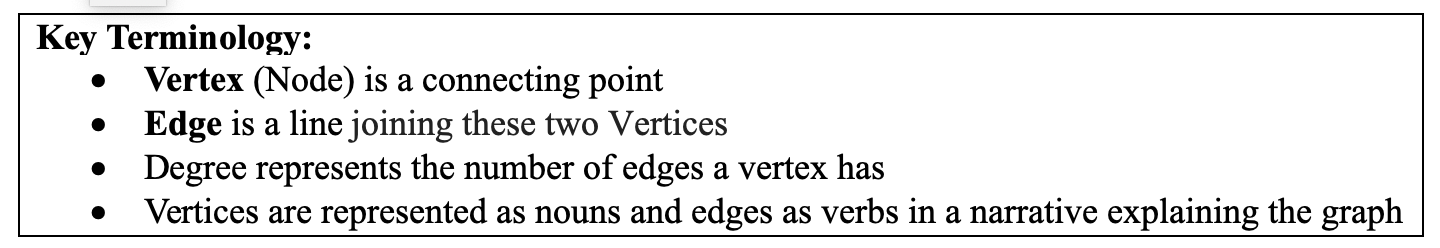
There are two fundamental structures that make up a graph:
- The lands represented by the dark green dots are called vertices, also called nodes
- The bridges, the relationship between the lands, are called edges
It is impossible to use those seven edges only once to get around the city. Figure 3 begins to lay out the solution using Eularian walk[2]. This solution presented in Figure 3 uses only 6 bridges/edges.
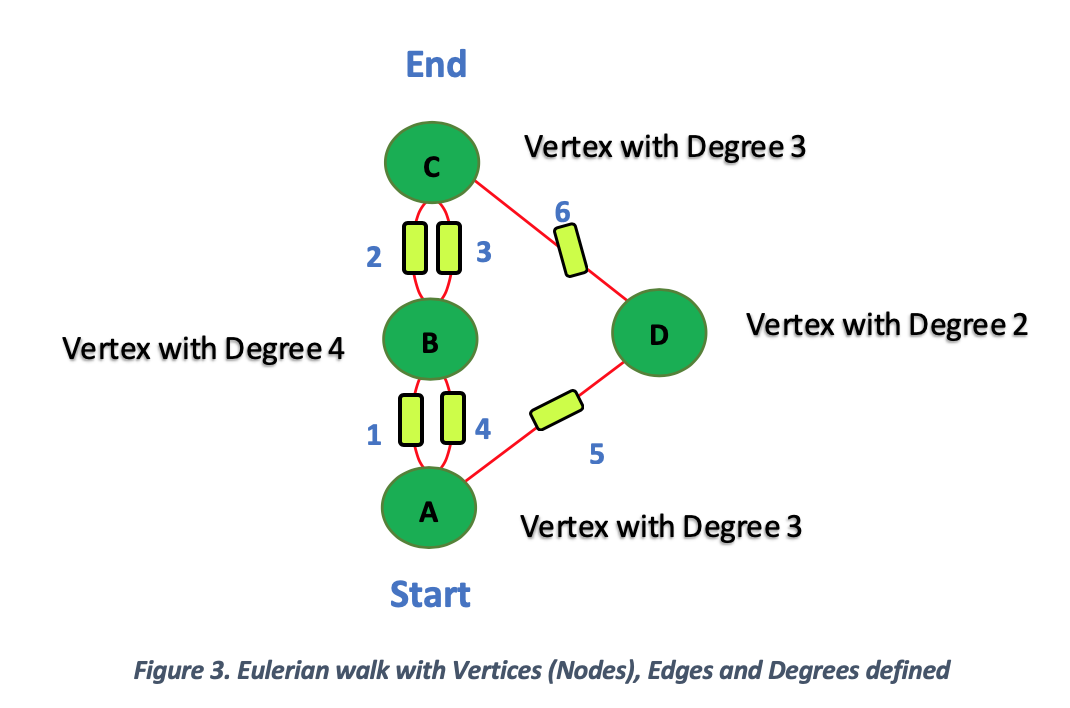
1, 2, 3, 4, 5, 6 represents the path followed to cross the city. A person walking the city will:
- Start out at the node shown in Figure 3 as ‘Start’ at Land A.
- Walk path ‘1’ to Land B
- Use path ‘2’ to walk to Land C
- Use path ‘3’ to walk back to land B
- Use path ‘4’ to walk back to Land A
- Use path ‘5’ to walk to Land D
- Use path ‘6’ to walk to Land C and End
The term degree represents the number of edges a vertex has:
- Vertex A has a degree of 3
- Vertex B has a degree of 4
- Vertex C has a degree of 3
- Vertex D has a degree of 2
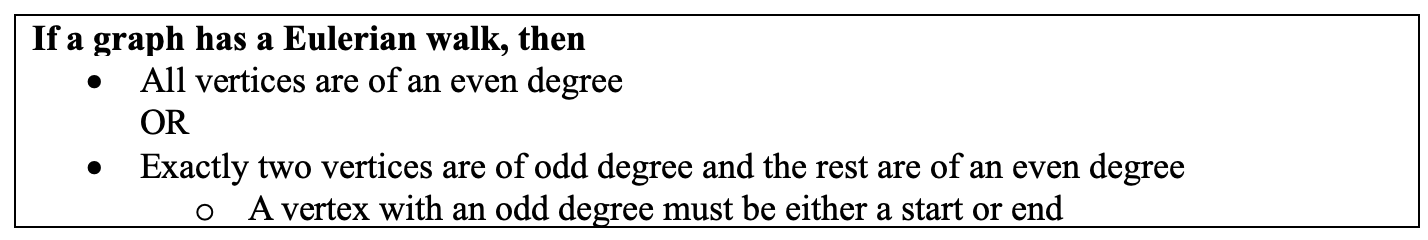
In Figure 3, with 6 bridges/edges satisfies the Eulerian walk rule with the following criteria:
- Vertices A and C are of an odd degree of 3 and the rest of the vertices B and C are of an even degree, 4 and 2 respectively
- Odd degree vertices A and C are the start and end respectively
Now you can see in Figure 4, why it is impossible to use those seven edges only once to get around the city.
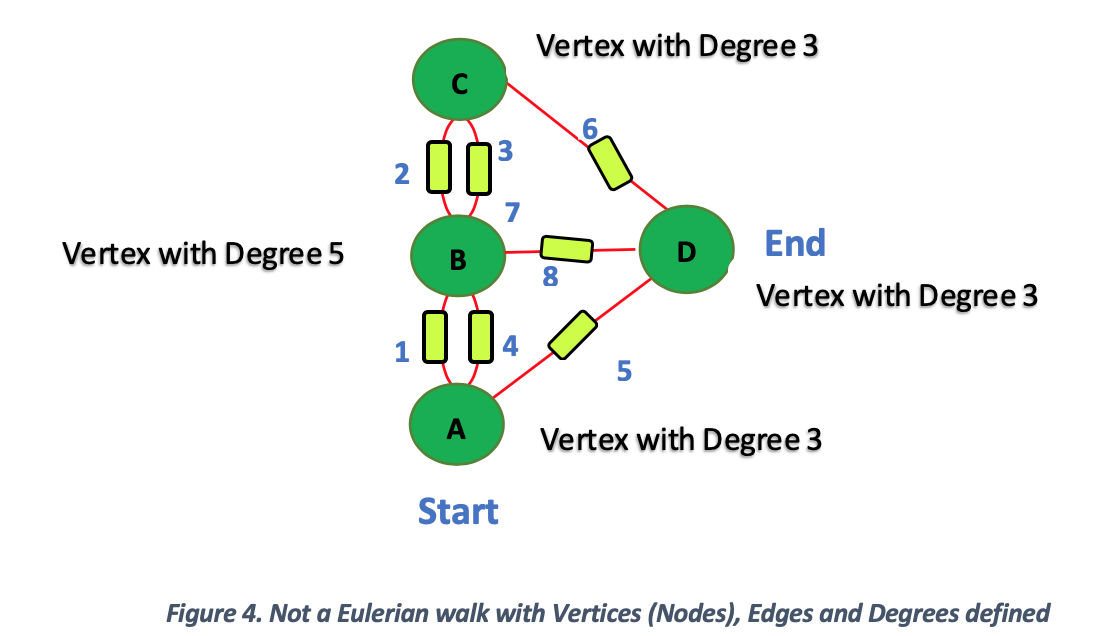
In Figure 4, one possible way a person walking the city will:
- Start out at the node shown ‘Start’ at Land A.
- Walk path ‘1’ to Land B
- Use path ‘2’ to walk to Land C
- Use path ‘3’ to walk back to Land B
- Use path ‘4’ to walk back to Land A
- Use path ‘5’ to walk to Land D
- Use path ‘6’ to walk back to Land C
- Use path ‘7’ to walk back to Land B (Note: This path is used 2 twice against the challenge to cross the edge only once)
- Use path ‘8’ to walk to Land D and End
In terms of degree:
- Vertex A has a degree of 3
- Vertex B has a degree of 5
- Vertex C has a degree of 3
- Vertex D has a degree of 3
In conclusion, Figure 4 DOES NOT satisfy the Eularian walk criteria due to the following condition:
- All vertices are odd degrees
In summary, a graph database is:
- A collection of vertices and nodes with explicit graph structure
- A database for sorting, managing, and querying highly interconnected and complex data
- A graph database’s architecture makes it particularly well-suited for exploring data to find commonalities and anomalies in large data volumes and unlocking the value in the data’s relationships
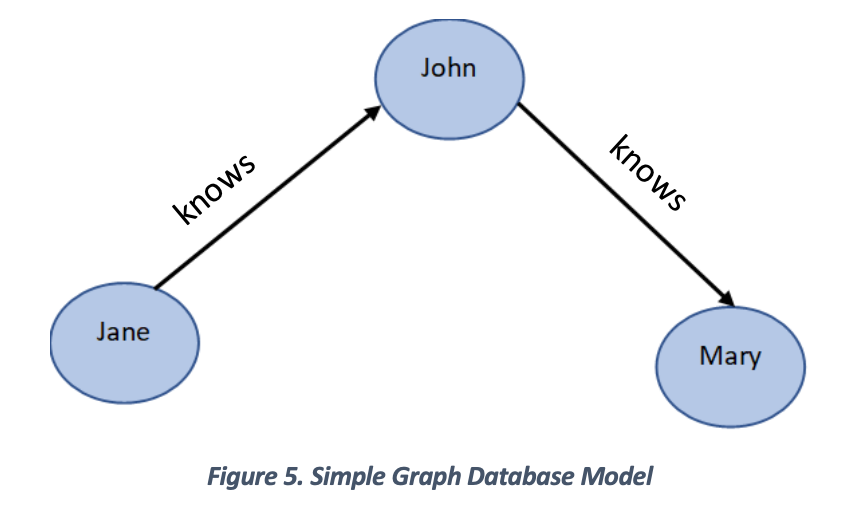
Figure 5 shows a simple graph example representing how people can be related:
Each node represents a single person who is connected with others through relationships. Figure 5 shows:
- Jane knows John
- John knows Mary
- Therefore, Jane knows Mary through John
Now, you have begun to grasp the basics of graph databases.
Coming up in the next article in this series:
- How the technology of graph databases has emerged.
- How a graph database is different from a relational database.
- To be continued….
Approved for Public Release; Distribution Unlimited. Public Release Case Number 19-2178
This quarter’s column is written by Anandhi Sutti with THE MITRE CORPORATION and has over 20 years of experience in Data Management. She has helped public and private sector clients to oversee and strategize the implementation of Data Management and Business Intelligence (BI) projects. She has strong expertise in Business Intelligence, Data Analytics, Data Modeling, Data Architecture and Data Strategy along with architecting complex systems and applications using a Software Development Life Cycle (SDLC). Anandhi has a master’s degree in computer applications and bachelor’s degree in mathematics.
The author’s affiliation with The MITRE Corporation is provided for identification purposes only and is not intended to convey or imply MITRE’s concurrence with, or support for, the positions, opinions, or viewpoints expressed by the author.
©2019 The MITRE Corporation. ALL RIGHTS RESERVED.
[1] https://en.wikipedia.org/wiki/Seven_Bridges_of_K%C3%B6nigsberg
[2] Eulerian walk in an undirected graph is a walk that uses each edge exactly once
