
UML as a Data Modeling Notation, Part 1
UML as a Data Modeling Notation, Part 2
UML as a Data Modeling Notation, Part 4
This article is the final installment of a three-part series. Part 1 set the stage, describing the basic differences between the notations and, in principle, how they can be reconciled. Part 2 went into more detail, addressing sub-types and constraints, along with both what elements in UML should not be used in a data model and what has to be added (unique identifiers).
Now, since the whole point of preparing a data model (regardless of notation) is to present it to management for validation, Part 3 discusses the aesthetics of preparing and presenting data models – no matter what notation is used. The series then wraps up with a brief discussion of some interesting quirks in UML that are worth noting.
This series has two audiences: The data modelers who have been convinced that UML has nothing to do with them; and UML experts who don’t realize that data modeling really is different from object modeling (and the differences are important). The objective of this series is to provide all modelers with guidance as to how to produce a high-quality conceptual entity/relationship model using UML class diagram notation.
Aesthetic Guidelines
What distinguishes an entity/relationship model from either an ordinary UML model – or a database design, for that matter – is that its first purpose is to be presented to the business community. It will be presented to people, most of whom have no prior experience with data models and who have little patience with things technical or echnological. For this reason, aesthetics is important.
In this respect, UML starts at a disadvantage.
In a conventional entity/relationship diagram, “cardinality” (whether an instance of an entity class is associated with one or more instance of another entity class, or with no more than one) is represented by graphic symbols – typically a “crow’s foot” (>–) to represent more than one, and either the absence of a crow’s foot or a mark across
the line ( – | – ) to represent just one. “Optionality” (whether an instance of a relationship is required in the first place) is represented by either a dashed relationship line or a circle {O} across the end of the line. Figure 1, from Part 1 of this series, shows this. The crow’s foot shows the many side, and the dashed line shows that at least one of the roles is optional.
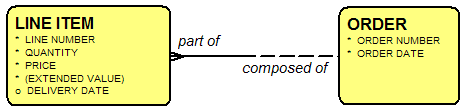
Figure 1: A Relationship in Barker-Ellis Notation
In UML, these concepts are represented by characters: “0..” means the relationship is optional; “1..” means that it is required; “..1” means that an instance of the first entity class can be associated with no more than one instance of the second class; “..*” means that it can be associated with an unlimited number of instances of the second class.1 Figure 2 shows this. Instead of seeing these concepts graphically, the viewer has to translate the symbols to understand them.

Figure 2: A Relationship in UML
This means that in presentations, patience will be required in explaining the cardinality and optionality notation to the viewers, but it is usually addressable. The following guidelines apply no matter which notation you are using.
Eliminate Bent Lines
On a drawing, any angle or intersection is a symbol that will draw the viewer’s attention. For this reason, there should be no “bent” lines, since each of these will appear to be a symbol for something. But there is no meaning to the bend, so it is a distraction to the eye.
The first step, then, is to stretch boxes as necessary to ensure that all relationships are represented by a straight line from one entity to the other. Note that if you do this, it is suddenly less critical to avoid crossed lines. While that is still desirable, if there is an occasional crossed line, the viewer typically doesn’t notice it since it can only be a crossing and cannot be two adjacent right angles. The viewer’s eye is focused on the line connecting two entities.
Figure 3 shows a drawing with a “spaghetti” approach to drawing relationship lines. You’ve been give this drawing with no documentation. How easy is it for you to grasp what it is about? Tests and measurements, yes. But what about them?
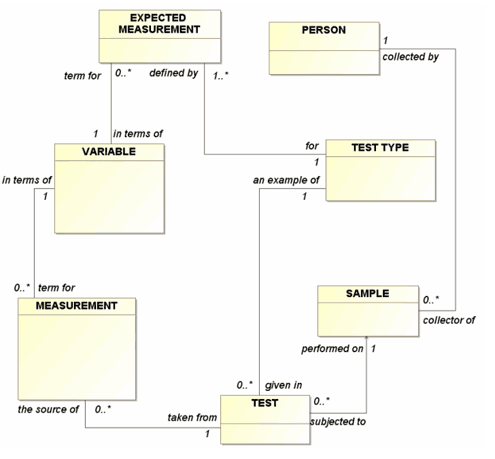
Figure 3: Bent Relationships
Instead of bent lines, Figure 4 shows the same model with straight relationship lines. This is easier. Tests are performed on samples, and measurements are in terms of variables. Still, the overall structure is not yet as clear as it could be.
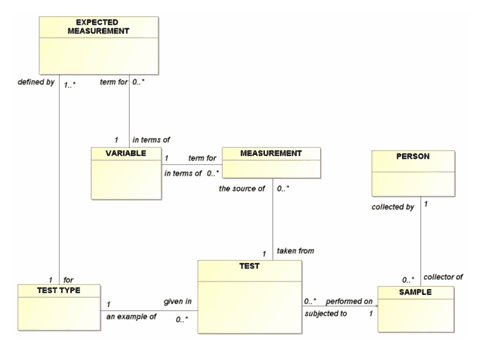
Figure 4: Straight Relationships
Orient “Many” End of Relationships to Top and Left
Notice that in Figure 4, even with the lines straight, it is not clear what the model is about. What is the “subject” of the model? Expected measurement? Sample? It’s hard to tell.
Orienting the relationship lines so that the “0..*” ends are at the left or toward the top of the diagram makes that clearer, as shown in Figure 5. Here, the “reference” entity classes, that describe relatively tangible things (PERSON and SAMPLE, for example), tend to collect in the lower right, while more transactional entity classes that are more abstract (such as MEASUREMENT), tend to collect in the upper left. Now you can see what the diagram is about (the reference entity classes) and what is describing those things. TESTS are performed on SAMPLES, and these are the source of MEASUREMENTS.2
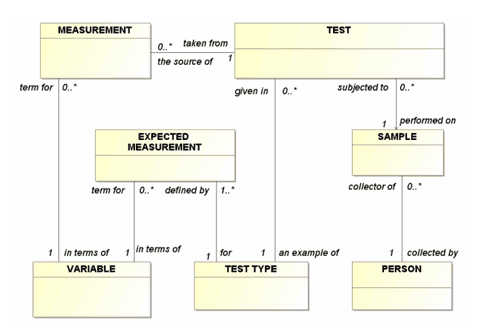
Figure 5: Properly Oriented Relationships
Presentation
Probably the worst thing ever invented for data models was the plotter. This permits modelers to create wallpaper-sized models that are completely unintelligible. If you have a plotter at your disposal, turn it off. Quietly and carefully…walk away. Pretend it does not exist.
If a model is to be presented to a human audience, it must be composed of individual sections that each have no more than 15 boxes on them, each describing a particular area of interest, typically called a “subject area.” Ideally, each subject area drawing would have no more than 9 boxes, but keeping the number small is hard.
The maximum limit, however, if the drawing is to be at all intelligible, is 15 boxes. Show even that many on a screen without any highlighting, however, and your audience will immediately bring out BlackBerries, knitting and/or origami paper – and tune out completely.
Note two things about presenting data models to an audience:
- You are not in front of this audience to present the drawings. They are only for taking notes. You are there to make the English language assertions that the drawing represents. Is it true that each clinical trial must be about exactly one compound? (It turns out that it is not. Each clinical trial must be to test exactly one compound. See how relationship names are important?)
- You are there to be wrong. You are not there to have the audience pat you on the head and be impressed. You will have made mistakes in your understanding of the business. It is much cheaper to learn about them now than to find out after a system based on your (incorrect) assumptions has been installed.
Present the model in small pieces, beginning with a diagram containing between one and three entity classes. Discuss the meaning of each. Discuss the attributes. Read the relationship sentences and get acceptance. Is it really only one? Might there be more? An ideal medium is overhead transparencies, so you can mark them up. At the very least, take notes (and be seen to be taking notes) for corrections.
The next slide will add between one and three entity classes. On this drawing, the new entity classes are highlighted. Use a contrasting color, but not one that is so dark as to make the text unreadable. Again, discuss the added entity classes and relationships. Continue this build up sequence until the subject area is complete.
Had you presented the last drawing first, you would have completely lost your audience. This way, though, the last drawing has only one to three entity classes highlighted. Some viewers will pretend that’s all they are seeing. Others can be pleased with themselves that they actually understand a complex drawing. No one (well, okay, almost no one) will have fallen asleep.
In 1956, G.A. Miller was decades ahead of his time when he published a landmark article that profoundly identified what is wrong with most PowerPoint presentations. [Miller 1956, pp. 81-97]. His research determined that human beings can hold no more than nine “objects” in their heads at one time. Specifically, people are most comfortable with “seven plus or minus two” things. This is why, when area codes were meaningful, most people could remember seven-digit local telephone numbers. Now that it’s really a ten digit number, it’s hopeless – this is probably the real reason why speed-dialing was invented.
The upshot is that if a slide has less than five bullets, it usually looks trivial. If it has 10 or more, it is too complicated to follow. Either way, the viewer immediately loses interest.
The same thing is true for data model presentations. If it is necessary to have up to 15 boxes, no more than three or four should be highlighted for the topic of any one slide.
(By the way, when the time comes to write up the model, take the same approach: Explain it in the text a little bit at a time.)
Dealing with Quirky UML Concepts
The object-oriented design environment includes concepts that are not part of the environment of entity/relationship modeling. Most UML tools will have these concepts lurking in the background, but they are not part of UML entity/relationship models. Still they are interesting, and understanding them adds to our understanding of the entity/relationship models.
Package
In the object-oriented world, a package is a collection of objects and classes. It can be used for almost anything. In the entity/relationship context, a package can be defined for a subject area, or it can be defined simply to refer to “the model.” “Package” has no inherent semantics, beyond its being a collector. UML does require each class to be in only one package, however, which limits its use as a subject area in the entity/relationship modeling context. The same entity class may indeed show up in more than one subject area.
Note that a “package” in object-oriented language is not the same as a “package” in some relational database management system products.
Instance Diagrams
UML has one feature that is very useful for validating a data model: instance diagrams. They are a bit complicated to describe here in detail; but, in essence, they allow you to specify a set of entity classes and their relationships with an instance of each to ensure that the relationships all make sense.
Namespaces and “Ownership”
Namespace is a concept that groups a collection of objects (including classes) to prevent duplicate naming. That is, a namespace is “owner of” a set of objects, and no duplicate names are allowed within that namespace. Implicitly, in an entity/relationship model, entity classes cannot have duplicate names, so the collection of them in a model
could be considered a namespace. Similarly, an entity class can define a namespace so that attributes within it are prohibited from being duplicated, although duplicates are allowed across entity classes.
Note that in entity/relationship modeling, attributes and roles are “predicates” (descriptors) of an entity class. Similarly, in UML, they are “properties” of the entity class.
A problem arises with UML role names. In some UML tools, all properties (attributes and roles) default to be part of the entity class’s namespace. But the related entity classes linked to the roles cannot be in that namespace. This means that, from the point of view of the entity, duplicate role names are not allowed. This keeps one from saying, (as in Figure 6, below, for example), that a PROJECT may be the object of one or more CONSTRAINED PROJECT ASSIGNMENTS, and it may also be the object of one or more OPEN PROJECT ASSIGNMENTS since the role name “the object of” cannot be duplicated.
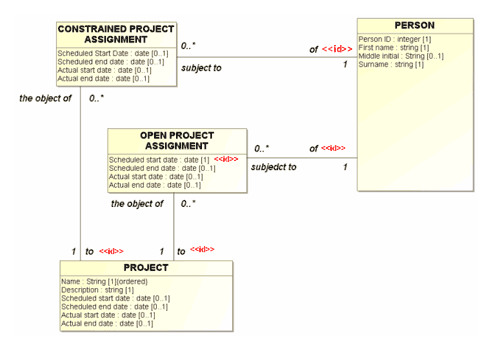
Figure 6: Duplicate Roles?
As it happens, this problem can be solved by designating that the role name is actually a property of the association’s namespace, rather than the entity class’s. That keeps the tool happy, but we can still recognize intellectually that both roles are predicates of the entity class.
This is annoying, but you can live with it.
Conclusion
Yes, E/R modelers, you can create an entity/relationship model in UML and have it meet all your requirements – if you’re willing to adjust your views just a little. And yes, UML modelers, you can create a genuine E/R model and present it to businesspeople – if you’re willing to adjust your views, just a little.
But lest we get too wrapped up in the perfection of our notation and our approach, we should remember:
“Essentially, all models are wrong, but some are useful.” [Box & Draper 1987, p. 424]
UML as a Data Modeling Notation, Part 1
UML as a Data Modeling Notation, Part 2
UML as a Data Modeling Notation, Part 4
References:
Barker, R. 1989. CASE*Method: Entity Relationship Modeling. (Wokingham, England: Addison Wesley).
Box, George E. P.; Norman R. Draper (1987). Empirical Model-Building and Response Surfaces, p. 424, Wiley.
Hay, D. 1999 “UML Misses the Boat,” East Coast Oracle Users’ Group: ECO 99 (Conference Proceedings / HTML File). Apr 1, 1999.
Hay, D. 2003. Requirements Analysis: From Business Rules to Architecture (Upper Saddle River, NJ: Prentice Hall PTR).
Miller, G. A. 1956. “The Magical Number Seven, Plus or Minus Two: Some Limits on Our Capacity for Processing Information,” The Psychological Review, Vol. 63, No 2 (March, 1956).
Martin, J., and James Odell. 1995. Object-Oriented Methods. (Englewood Cliffs, NJ: Prentice Hall).
Page-Jones, M.2000. Fundamentals of Object-Oriented Design in UML. New York: Dorset House). Pp. 233-240.
Rumbaugh, J., Ivar Jacobson, Grady Booch. 1999. The Unified Modeling Language Reference Manual.
End Notes:
- For a comprehensive comparison of data modeling notations, including all described here, see Appendix A of [Hay 2003] or go to http://www.essentialstrategies.com/publications/modeling/compare.htm.
- Yes, we know that there are some heretics among you (Canadians?) who prefer to orient the relationships with the “many” end towards the right and the bottom. “How can this be?” we ask. Okay, it can be, and it actually is fine, as long as you adopt a convention and use it consistently.
