
There are many perennial issues with data: data quality, data access, data provenance, and data meaning. I will contend in this article that the central issue around which these others revolve is data complexity. It’s the complexity of data that creates and perpetuates these other problems. As we’ll see, it is a tractable problem that is rarely tackled head on.
What Is Data Complexity?
In the height of the “big data” craze, we were reminded that the three V’s (reasons that big data was hard and/or necessary) were Volume, Velocity and Variety. If you have a single simple data structure, say a signal coming off an IoT device, or a click stream log, you can have billions of rows (Volume) and even have them coming at you in real time (Velocity), but their simple structure, their lack of complexity (low Variety) means the data will be relatively easy to deal with.
But as soon as we crank up the Variety (complexity), the wheels come off our data processing cart, big data technology or not. Let’s dig a bit deeper into what this complexity actually is.
The surface level writing on big data focused on Variety in high level data formats (introducing unstructured text, audio, video and the like). This Variety does add an extra dimension of complexity. But let’s drill in on what at first seems to be the simpler part of Variety: within structured data.
With structured data, we know (somehow, and this will be a lot of the substance of this article) what each field in a structured data set means. We might know that the first 12 characters in a record are the equipment identifier. We might know that the data between the second and third “!” is the CPT code. We might know that the fourth column (cell really) in a table is the ambient temperature. We might know that the value following the key ‘amount:’ in a json file is the pretax value of the order line item. We might know all this. In fact, if we are going to process the data, we pretty much need to know what it all means.
But knowing this is hard. You might think in those few examples in the previous paragraph that it wouldn’t be all that hard. People have been dealing with this for decades. But let’s look at what dealing with this for decades has brought us.
One of my colleagues, Mike Atkin, refers to the “bad data tax.” This is a special case of that, the “complexity tax.” And the complexity tax is not just levied on software developers. Every person that needs to fill in a form or interpret a report is subject to this burden.
How Much Complexity Is There in My Data Landscape?
Every distinction made in your information systems is a new concept that must be known by someone in order to process or interpret the data at hand, regardless of its Volume or Velocity. Every column in every table in every database represents a specific new concept. Many of them are the same or similar, but you don’t know which ones.
Data complexity can be estimated as the number of concepts a human will need to know to process the data correctly.
A rule of thumb I’ve noticed in our work with firms of many sizes is that there tends to be about one application system for every ten employees in a company. We work with a firm that has 110,000 employees and has a good inventory of systems. And sure enough, they have 11,000 applications they’re managing. A pharmaceutical firm we know has 55,000 employees and 5,000 apps. Even at the lower end, one of the clients has 1,500 employees and 200 apps. The ratio gets more extreme the smaller you get. We (Semantic Arts) have 30 employees and 20 applications. We are working hard on reducing this. There are exceptions. We did some work with a restaurant chain and a hotel management firm, and while they have thousands of systems, they have identical schemas, so for them the complexity doesn’t scale with the number of systems. And we occasionally encounter firms that have been working on application rationalization who have managed to halve these ratios, but they are still large numbers.
In order to approximate how much data complexity you have, you have to answer two questions. The first is: How many different applications do you have? Say you’re in a 10,000-person firm. From the above, there is a good chance you have 1,000 application systems in use to manage the organization. It’s possible that you have a lot less than 1,000 application systems, but if you think you do, it’s as likely that you don’t have a good inventory as it is that you are that parsimonious.
The second question is: What’s in all those applications, that is how much complexity is there in each system? This varies far more than the number of applications per company. At the high end, applications such as Enterprise Resource Planning and Electronic Medical Record systems have hundreds of thousands of attributes (fields, columns, keys, properties, whatever you want to call this lowest level unit of data complexity). Systems that you procured tend to have more attributes than those you have built yourself for the same scope because the vendor is attempting to cover many more circumstances than you have in your context.
It is rare to find applications with only a few hundred attributes, although they do exist. For our purposes here, I’m going to use a very conservative average and say that on average, each of your applications has 1,000 attributes.
So, our typical 10,000-person organization with 1,000 applications has 1,000,000 concepts to understand in order to manage their firm. Think about this for a second. The typical human being has a vocabulary of 20,000 – 40,000 words (concepts). The data landscape of a medium sized enterprise is 50 times more complex than you could ever understand, even if you devoted your career to it.
No one can come anywhere close to understanding all of this. Before we get to strategies for overcoming this, we should spend a few minutes to review how we got here, and what we do to keep ourselves in this overwhelmed state.
People Like Data Complexity — Up to a Point
Have you ever picked up someone else’s Excel spreadsheet (or even one you built more than a few months ago)? We all seem to have this proclivity to keep adding complexity, right to the point (and often just beyond it) where we can just barely understand what we have done. There is always another extra variation, consideration, parameter that we want to add to make the result a bit more meaningful. But it comes at a cost. The cost is complexity and risk. Even though we’ve been exhorted to repeatedly, we rarely go back and refactor out the unnecessary complexity we’ve added. (This is true of code as well, but I’m focusing on the data side).
When a data modeler interviews a subject matter expert, they always seem to be delighted to discover yet another concept, and it is dutifully added to the data model, increasing its overall complexity.
We seem to like complexity. Especially the complexity we created. We’ve invested a lot and can understand the complexity we created. And it gives us a bit of pride, a sense of accomplishment and often some job security. But we don’t like other people’s complexity. Other people’s complexity taxes us. It requires us to recreate some of the investment they put in to building that complexity.
It’s a bit like the old “stuff” routine1
“Did you ever notice that their stuff is shit, and your shit is stuff?”
— George Carlin, 20th century linguist and philosopher
Other people’s complexity is shit.
Dealing with Data Complexity
There are a lot of tactics people employ in dealing with data complexity. These tactics include data profiling, meta data management, data cataloging, and various forms of automation including generative AI. I’m going to suggest that any of these tactics can work with any strategy, but first we need to be a bit more intentional about what strategy we’re following.
I’m going to contend that organizations settle in on one of these three overall strategies for dealing with data complexity:
- Divide and Conquer / Partitioning
- Abstraction / Simplifying
- First Principles /Deep Understanding
Divide and Conquer / Partitioning
By far the most prevalent strategy for dealing with data complexity is dividing and conquering. This is precisely why we have so many applications. When a new problem comes up, the existing systems and their data models don’t solve it. If they did, it wouldn’t be a new problem. The existing systems are already complex (most applications are at the size and complexity where one person or a small team can understand the whole thing, but some large applications need large teams to deal with their complexity). In any case, the solver of the new problem might attempt to graft the complexity of the new problem onto the complexity of the existing system (or systems). Often, however, the rush to get something done inclines implementors to the local greenfield option. Plus, the idea of declaring a new application provides the option of purchasing a system or renting a service (Software as a Service, SaaS).
Off they go. More copies of existing data are made and transformed to their local needs. And a new silo is born. And a continuing stream of integration debt is incurred.
This is considered normal behavior. This is literally what everyone is doing.
Abstraction / Simplifying
Occasionally, people stumble onto the problems that unchecked complexity creates. One response to this is to abstract the data model up to a point where it can be comprehended by mere mortals, including business sponsors, most of whom are mere mortals.
The problem with these abstractions is that they are usually only vacuously “true” and aren’t helpful for implementation. Here is a classic example that landed in my inbox yesterday.
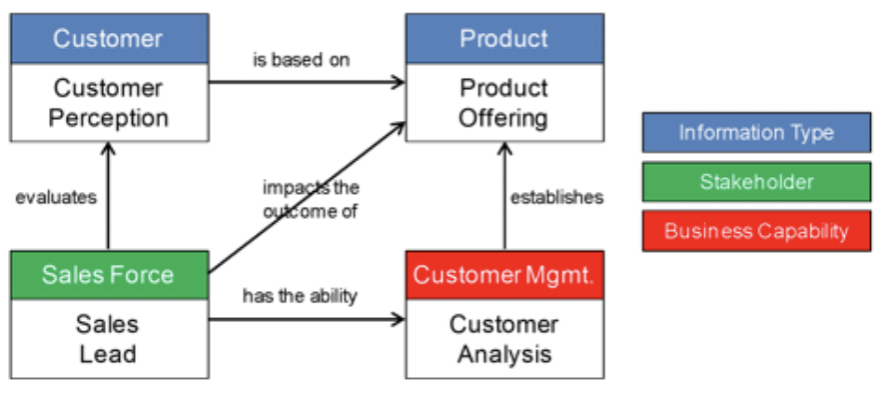
It’s not that this is wrong or anything, it’s just at a power point level of detail and rigor. These are pretty “wooly” ideas. I would defy anyone to port their ERP or CRM data to this model, losslessly.
As most enterprise data modelers know, you take a model like this, at the “conceptual level” and transform it to a “logical model” and then finally to a “physical model” where all the details somehow are re-discovered.
As well intentioned as these abstract models are, they are rarely useful. I would like to say never useful, but the open world assumption2 causes me to think there might be a useful one out there I’ve overlooked.
One of the more telling problems with these abstract models is that business sponsors keep implementing packaged software that doesn’t conform to the abstract model (indeed it wasn’t even aware of the abstract model). And after the fact, there is little the abstract mode can do other than suggest “there’s probably some of this type of information over in that new system.”
Maybe I was a bit harsh in my abstract model critique, as it can form the role of cross-referencing applications to the type of data they contain. So, let me soften my prior rant. While abstract models are of limited value in system implementation, or in stemming the tide of rising complexity, they can fill a role of cross referencing where key data types live.
First Principles / Deep Understanding
Let’s move on to the strategy that actually works in reducing data complexity — one that moves beyond surface appearances. This strategy has been proven in over 100 projects, and despite our proselytizing it for over a decade, is still only known by relatively few people. And now, dear reader who has persevered and made it this far in the article, it is known to you as well.
We sometimes call this “first principles understanding” or as Oliver Wendel Holmes said, “the simplicity on the far side of complexity.”
For the simplicity that lies this side of complexity, I would not give a fig, but for the simplicity that lies on the other side of complexity, I would give my life.
— Oliver Wendel Holmes
I’ve always had a fondness for the term and the ideas behind “First Principles” as my first consulting company in the late 1980s was called “First Principles Consulting.”
First principles’ understanding takes a deep look to get to the heart of the matter. Every concept in a functioning application means something, even one I came across on a project I inherited called the “into-go-down-price” (don’t ask me now, but there was a time I knew what this meant). Every label means something. It may mean only what the users collectively have decided it means (User field 1 might be the prospect’s golf handicap, but if it is that’s what it means, then that’s what it is).
It may seem hard to believe, but the closer you get to what something really means, the simpler it (usually) becomes. Sometimes understanding adds a bit of local complexity, but it almost always gives it back in vastly reduced global complexity. For instance, the first time you dig into “Social Security Number” and realize (and model) it is an identifier of a person assigned by the Social Security Administration for the purpose of accruing payroll tax deductions to an individual’s United States sponsored retirement program, that may seem to be more complex than just throwing the label “SSN” on a column. Your effort will be repaid a hundred-fold when you use this newfound knowledge to determine whether the hundreds of other places you have something that looks like an SSN either is or isn’t. You will have gained in complexity reduction. This isn’t a hypothetical; we were working with a major insurance company, and in parallel to our modeling work, they were executing an enterprise-wide data profiling exercise. At the conclusion, they found 8,300 places in their various systems where they were storing social security numbers or something that looked like them.3 Many of these were not in columns called “social security number” or even “SSN,” but were in “tax ID,” “user id,” and dozens of other headings. Many things that might fall under “tax id” or “payroll tax identifier” or “user id” are not social security numbers, and by making this more explicit, we begin to get a handle on the similarities and differences.
The deeper model of SSN seems more complex at the outset, but there is a big payoff. It eliminates the need for hundreds or thousands of strict synonyms that have been implemented for SSN. We find that SSN is just one of dozens of identifiers that have been assigned to people by third party organizations. This further eliminates the need for hundreds of additional attributes with names like “Motor Vehicle Driver Id,” “Drug Enforcement Act Provider Id,” “Member Number,” and on and on.
I’ve gone into a great deal of detail on a very small part of the issue, but I did so to make the point that the kind of simplification we’re talking about here is not one of abstraction and loss of fidelity and distinction. Just the opposite, it adds resolution even as it reduces complexity. And this is just one of dozens of patterns. The whole of an enterprise’s datascape reduces to simple building blocks.
What we have discovered in over 100 implementation projects is that even a large company’s data model can be captured in fewer than 1,000 concepts. Not only are 1,000 three orders of magnitude less than the 1 million or so concepts currently being managed by medium sized organizations, more importantly it falls well short of the human cognition threshold. The 1,000 concepts that must be mastered to understand the datascape is a small and manageable percent of the typical adults working vocabulary (2-5%) as compared to the 50-fold expansion of their vocabulary that would be needed if they were to attempt to understand all the data in a firm.
At this point, you might think “Yeah, ok but it’s still just a model, maybe a bit richer, but no different in principle than a traditional conceptual data model.” But there is a critically important difference from traditional conceptual data modeling.
The properly constructed model is directly implementable. It’s beyond the scope of this article, but the preferred implementation of the model and data that conforms to the model is with a Knowledge Graph conforming to W3C standards.
Not only can it be directly implemented with data that already exists, but we can also posit that you don’t know if the model is right until you do. The process involves understanding the existing data and mapping it to the simplified “core model” (we’re calling it a “core model” for the part of our audience who may have allergic reactions to terms like “ontology,” but that’s what it is). Data from many systems be conformed to the core model and in the course of doing so, they become integrated.
In the short to medium-term, this integrated knowledge graph performs a role similar in some ways to a data warehouse (normalizing data from many sources), to systems integration (getting data from many sources to interoperate), and to a data lake (co-locating data), but as it evolves, it becomes more than this simple beginning. As the Knowledge Graph and its attendant architecture evolve, organizations realize that they can implement use cases directly on the graph. Because the core model is simpler, the implementations are simpler. Over time, the graph becomes the basis for what was previously application functionality.
As legacy systems wither, the data landscape keeps shrinking until it finally becomes the core model.
Summary
Data complexity is a tax on everything the enterprise does. Any initiative, whether it is a digital transformation, a legacy modernization project, a data mesh implementation, a garden variety systems implementation extension, or an AI based enterprise search project, the data complexity tax makes it far, far harder than it might otherwise be.
We have found it possible to take up to three orders or magnitude of complexity out of an enterprises datascape, without sacrificing fidelity or precision.
Data complexity can be tackled head on. This model can set the cornerstone for the gradual evolution of data chaos into data understandability.
