
In the previous installment of this series, we outlined a progression that we believe firms can and should work through as they use metrics to try to make change in their enterprises.
In this part, we take a single specific metric, aging of accounts receivable, and trace its evolution from a back-office measure to a proactive intervention. The progression we outlined in the previous article was from initial measure to root cause and better measures:
- Measure and superficial clean up
- Formal semantics
- Calibration
- Prescriptive action
- Root cause
- Better metrics
A Detailed Case Study of the Evolution of a Metric
Some of the illustrations here are from a presentation prepared for accountants in architectural firms, called “Three simple systems to reduce chaos and overwhelm”3 by Mike Linn of Linn Accountants. Rather than make up something contrived, I opted to use these examples, which appear to be anonymized versions of financials that Mike has observed in architectural firms.
The realm is aging accounts receivable. You have a receivable when you grant your customer credit, which is another way of saying you let them pay later. Typically, you do the work and then send an invoice. At that moment you have a “receivable,” and the collective noun for them is “accounts receivable.” The amount of time from the sending of the invoice to the receipt of the payment is the “age” of the receivable (in days). The older a receivable is, the less likely you are to ever collect it. If you do not collect on an invoice, you must “write it off,” which means you did the work and didn’t get paid. This is a bad outcome. Every accounting system creates a report, much like the ones you are about to see called the “aged accounts receivable report.”
Let’s watch this common metric evolve through our six-step program.
Measure and Superficial Clean-Up
In Mike’s training class, this was the “before” AR aging.
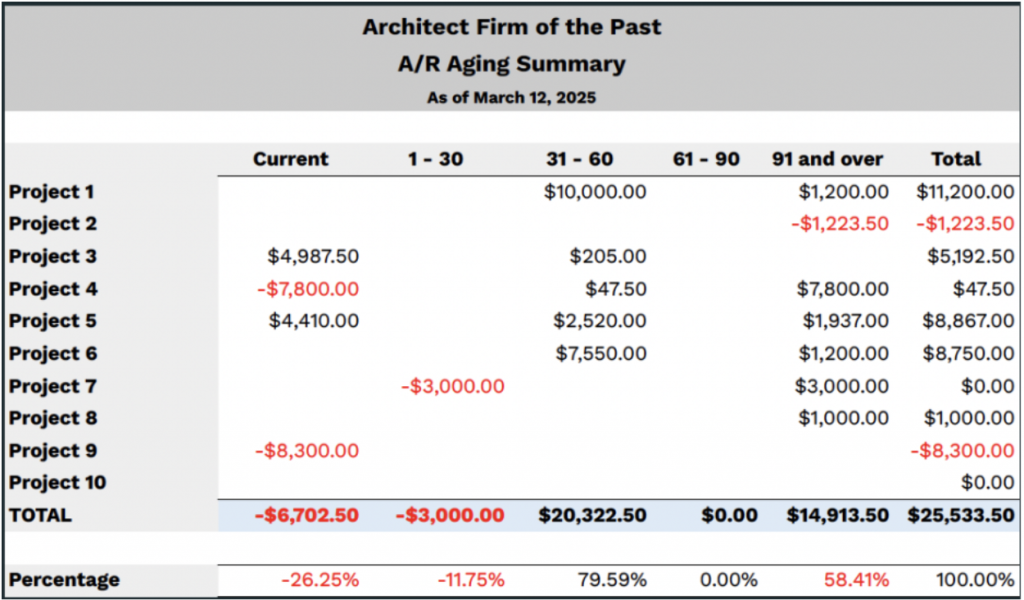
This is almost universal. For centuries, accountants have been bucketing unpaid invoices into these five categories based on age.
It is a bit of a mess, and not very helpful for anything. How can projects 2 and 9 have negative receivables? In most scenarios, this isn’t even possible, but here they are. More than likely the cash receipt process allowed someone to book a payment to the wrong project. Also look at project 4: There are negative receivables in the current period and an equivalent amount that is 90 days old. That is almost certainly a payment that wasn’t applied to the right invoice.
The real problem here is the data is of such low quality, you wouldn’t share it with anyone and there is little action you would take on it.
In the second “future” version, Mike has helped the firm clean up its misapplied payments and now has a clean looking aging.
Now we’re ready for the first level of behavior driven from data. There are typically two species of action that this drives:
- Calculating bad debt allowances — one of the main uses for the aged accounts receivable report is to predict and allow for bad debt. It is common to assign a percent to each column in this report. If we applied a common rule of thumb, we’d say 1% of current AR is going to end up uncollectable, 4% of the 30-60, 10% of the 60-90, and 30% of the 90+. For this example, this would give a bad debt allowance of a bit over $2,500, which is about 7% of their total outstanding. At this point, the metric is merely being used to predict a bad outcome.
- Collection — no one wants the bad outcome. Hopefully, the company is doing something to collect on these invoices. You want to collect on all of them, but you usually don’t call in the big guns until they get quite late. More on this later.
Formal Semantics
What starts happening, especially if you send your project managers out to your customers to collect on their “bad debt,” you start learning some things about your systems.
The first almost comical thing is figuring out what date you are using and what it means. Is it based on the invoice date, which is really: “How many days old is the invoice?” Most systems drive this report from the invoice due date. Take a closer look at your invoicing processes, and you’ll likely find a practice that many small businesses adopt, which is defaulting the due date to the invoice date. There is usually a note: “Invoices are due on presentation” or something like that, and so they don’t want to give the client another 30 days.
But this really messes with your metric. If the two dates are the same, you cannot distinguish days in AR from days past due. The deeper you get into this, the more you realize that you want to manage the latter.
Your project managers that you send out to do the collection will find out soon enough that, for instance, you have a master agreement with your customer with terms of 60 days from invoice date. If that is the case, you really should have a due date 60 days from the invoice date for those customers. They are not late until 61 days after the invoice date.
But what of the customers that don’t have a master agreement? You may still want to say the invoice is due on presentation, or perhaps in 30 days. Either way, you might have some experience with them over time and learn that client A typically pays in 20 days and client B in 45. You don’t necessarily want to make that your “due date” — perhaps you have another date that doesn’t show on the invoice called the “expected date.” This is going to be very useful for taking action and for accurate cash planning.
Calibration
Most of our payments now come from direct bank to bank ACH (Automated Clearing House) transfers. Some send a notification, others don’t. We’ve learned that, before declaring an invoice past due, we should check with the bank to see if it is there. That is one level of our calibration. We also keep an actual payment-received date, so that we can continually refine our estimated due date.
In 25 years, we have only had one account that we had trouble collecting on, so we are not calibrating our bad debt, we are doing everything we can to not have any.
Prescriptive Action
When an invoice crosses the past-due point, we know we have a problem. We are moving from an analytic timeframe, which is very much after the fact, to a real-time timeframe. Historically, invoicing and remittance processing were batch processes that we got around to when the more urgent work had died down. Running the aged accounts receivable had to wait until all the bookkeeping was done. And it had to wait on someone to study the report and consider whether it should be forwarded to anyone for action. Usually, a perfunctory email was sent.
Now, we are moving to a notification system. We will probably quit producing the aged AR report.
We have also noticed (from our root cause analysis below) that the invoice that we typically have the most trouble with and the most trouble calibrating is our first with a new client. The cynical part of me wants to believe that all the excessive systems validations, handoffs, authorizations, etc., were set up intentionally to thwart an invoice submitter, but then I’m reminded of Hanlon’s razor.
“Never attribute to malice that which is adequately explained by stupidity.”
Hanlon’s razor
And here I am not referring to individual stupidity, but the collectively stupidity of those who built the systems and procedures. We have learned that the first invoice is a learning process for both companies. We spend a lot of time understanding the process (often now we are required to submit our invoices through a third-party system) and the constraints (in one case our bank number had to be in a very exact position on the pdf of our invoice — most of our other clients now do not accept PDFs).
Having been notified, it is time to act. The action you take will probably be one of:
- Harsh warning or pestering
- Working out payment terms
- Threatening to cut off credit or stop work
- Actually cutting off credit or stopping work
- Turning invoices over to external collection agency
But deciding which to do is at least in part inspired by the root cause analysis.
Root Cause
At this point, we are no longer doubting our metric. If the metric says they are late, they are late. Now we move on to “why.” From a number of examples, we have concluded that these are the primary reasons that clients (at least, our clients) are late on a payment:
- Financial stress — the customer may not have enough money to meet all their obligations. This was our only source of very late payment in our history: A venture-funded client did not get the next round of funding they were expecting and were essentially insolvent but didn’t want to admit it.
- Dissatisfaction with service — sometimes clients withhold payment because they are not happy with service or want to extract some additional concession.
- Problems with their systems –- we had a client ask us to invoice them in December to hit that year’s budget but then not pay us until May. Not for either of the above reasons — they were trying as hard as they could — but their internal system was very difficult to navigate.
- Problems with our systems — sometimes the problem is on our side. One that we discovered lately, for some projects we take the full project amount, divide it by the number of months and bill that amount each month. The only problem with this is when we find a client payment (through our bank ACH) we assume it is for the oldest outstanding invoice. On at least two occasions this wasn’t the case, and we were not able to find the problem until the end of the project. One of the payments was late for almost the entire duration of the project without being detected, and might have been missed entirely if we didn’t reconcile them at project close. This is far too late to be uncovering something like that, so in our new system, every invoice has a different dollar amount.
- Scheduling by nudging — some people are just squeaky wheel types and postpone doing administrative tasks until they are prompted. We find nudging a week before the due date to make sure “everything is set up right” is a good intervention for these.
- Their own metrics — some companies have their own metrics that factor into their payment priorities. Maybe they delay as long as possible, unless there are financial incentives. We worked with one company whose metric was they tried to keep their Accounts Payable higher than their Accounts Receivable and would drag out payments sometimes for that reason. We’ve heard of other companies that rank order their payables by incentives and penalties they will incur.
That array of possible causes suggests that different interventions (and different preventative measures) are going to be more or less effective depending on the actual root cause.
This is where making a testable hypothesis comes in. Based on some secondary information (maybe a credit report, maybe some other behavioral clues) you may choose a response and then see if the reaction correlates to the diagnosis. For instance, if you believed that your customer was prioritizing payment for those that had incentives, you could try putting a small penalty or a small gain (remember when there was a term called “2/10 net 30,” which meant you would get a 2% discount if you paid in 10 days, but in any event it was due in 30 days?). I don’t think anyone would offer those terms now, but even a half a percent might be enough to incent this type of customer.
Better Metrics
By the time the evolution comes this far, the metric has changed considerably. As you recall, it started life as an aging by buckets to predict bad debt for the bad debt allowance. As such, it was an aggregate report that was prepared monthly. It eventually became a notification of those customers who had, on the previous day, become late.
After a while it becomes evident that the first goal, trying to minimize bad debt, could easily be achieved by not issuing credit at all, but at what cost? We’ve worked with restaurateurs who do not accept credit cards because of the fees. We are almost certain the additional spending that comes with credit cards probably more than makes up for the fees. One suspects it has more to do with reducing tax reported income, but they are not likely to profess that as a motive. In a similar way, companies could eliminate bad debt expense by refusing to offer credit, but in most industries the effect on revenue would be stark.
Now that, for us, bad debt is all but a thing of the past, the new metrics that we are more interested in are:
- Estimated cash date — we are now much more focused on predicting the date we will receive cash for each invoice. At Semantic Arts we are going further, and predicting this at the time of contract, rather than the time of invoice, this gives us a much longer cash planning horizon. This metric isn’t an end user metric, but factors into the weekly future cash plan.
- Accuracy of predicted cash date — a secondary metric we are just starting to track is how accurately did we predict when the cash would arrive. This essentially gives confidence bands around our cash projection.
- Bad debt as a percent of sales — We’re not trying to provide an allowance for bad debt expense, nor a prediction based on age, but we recognize that bad debt may occur at some point. When it does, we’re more interested in it as a percent of sales rather than outstanding receivables. Bad debt is an overall risk of extending credit and should be viewed as such.
Summary
Companies rarely reflect on why they have implemented metrics in their enterprises; they just keep loading up BI tools and dashboards with ever more variation on things that are measurable and hope to get better results.
A few moments of reflection and we realize that much of the effort is intended to change behavior. As the metric becomes more accurate and more relevant to the locus of attention on the behavior change shifts. This shift is greatly enabled the more unified the data landscape of the firm is, and therefore the broader scope for behavior change.
This column outlined a progression that we think could have broad applicability and could aid practitioners in crafting metric interventions that are focused on ultimate causal behaviors and are therefore more impactful.
