
Bedtime stories are as good as the problem they solve, every child will tell you that. Our children’s capacity to distinguish a good story from a bad one is not learned, but hardwired from birth. Storytellers and parents know this very well. It is just natural: humans have been telling stories for thousands of years, orally or in writing. Some even argue that telling stories in the form of gossip accounts for 65 percent of all human speaking time.[1]
Personally, I would venture to say that what makes us humans is precisely the capacity to tell stories. Indeed, a defining feature that separates us from the animal kingdom is our fully-developed language capacity. You and me, dear reader, are communicating through time and space right now thanks to it.[2]
But what is a story? If we want to talk about data storytelling in social research, this would be a good question to start with. A quick Google search will reveal that a story can be defined as “connected series of events told through words.”[3] There are two things I like about this definition: First, it mentions the raw material, words, which are the building blocks of storytelling. Second, it conveys the idea of organization by pointing out to the notion of a “series of events.”
From this definition, it follows that storytelling would be the art of using words and organizing them along a plot line or series of events.
The obvious metaphor here is Jorge Luis Borges’ short story, The Library of Babel. In it, the Argentinian master describes a “vast library containing all possible 410-page books of a certain format and character set.” The storyline is that “Though the order and content of the books are random and apparently completely meaningless, the inhabitants believe that the books contain every possible ordering of just 25 basic characters (22 letters, the period, the comma, and space). Though the vast majority of the books in this universe are pure gibberish, the library also must contain, somewhere, every coherent book ever written, or that might ever be written, and every possible permutation or slightly erroneous version of every one of those books.”[4]
For purposes of our discussion, what is relevant of Borges is that all stories are in essence words placed along a fixed continuum of moments or elements. This YouTube video from Khan Academy develops this idea by proposing six specific story elements. The first is exposition, where “we learn about the characters and the settings;” the second is conflict, a problem faced by the characters; the third is rising action, which develops as the characters try to solve the conflict; the fourth is the climax, where the characters’ efforts and the conflict cannot go any further; the fifth is falling action, where the conflict is solved and the action slows down; and the sixth and final is resolution, where all loose ends are resolved.
At this point you might ask: “Sounds good, but what about data?” Fair enough. Let’s change gears and bring data into our discussion.
What is data storytelling? Well, if storytelling is the art of placing words in the right place along a plot line or series of events, data storytelling would be the art of correctly placing words and data along the same line, right?
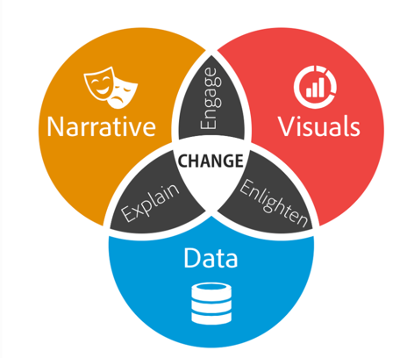
Brent Dykes, author of Effective Data Storytelling, suggests something similar in this article. He argues that data storytelling consists of three elements: data, narrative, and visuals. These three elements would interact as in the chart below. To paraphrase Dykes, combining narrative with data helps to explain insights; applying visuals to data reveals insights hidden behind charts; and merging narrative and visuals engages and entertains an audience. All in all, Dykes suggests that: “When you combine the right visuals and narrative with the right data, you have a data story that can influence and drive change.”
Regrettably, social research as an enterprise of causal inference tends to over-focus on the data and the visuals, disregarding the narrative. In fact, we social researchers have been repeatedly called to give due consideration to the first element of a story: the problem, or conflict to use the vocabulary of Khan Academy. Perhaps no one has expressed this opinion more forcefully than that of Ian Shapiro, a political theorist at Yale, in his long-winded titled article “Problems, Methods, and Theories in the Study of Politics, or What’s Wrong with Political Science and What to Do about It.”[5] For Shapiro, there is something profoundly wrong with the way we conduct research, which is that our discipline tends to be “too method driven and not sufficiently problem driven.”[6]
Shapiro argues that our chances of advancing our knowledge increases when we start “with a problem in the world, next coming to grips with previous attempts that have been made to study it, and then defining the research task by reference to the value added.”[7] In other words, the problem will dictate how we approach it and which methodological tools we need. In terms of data storytelling, what Shapiro suggest is that every good story starts with a real-life problem, or conflict, that speaks to us in our daily lives, that is meaningful because we recognize it, and because it touches us in some way. From this perspective, it would be up to the researcher to explain and frame his/her research question as a real, meaningful human and social problem.
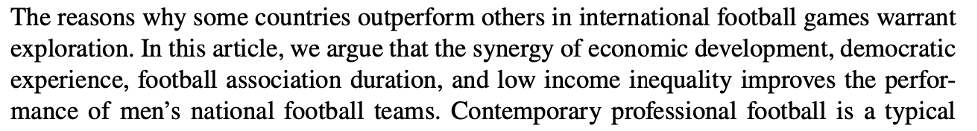
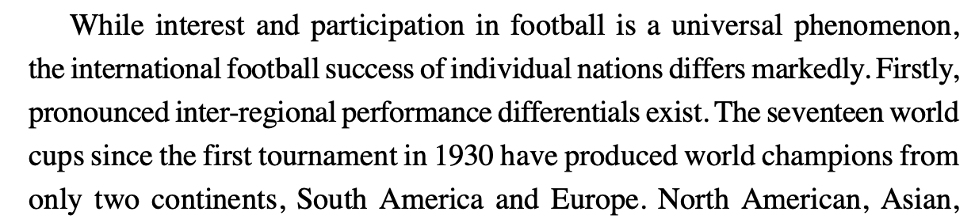
Let’s see an example of how researchers are more or less successful at doing this, allowing for the possibility of moving into an engaging narrative. Below are four problem statements from four journal articles that deal with same question: What are the determinants of success in international football? The question by itself might seem frivolous, but read and compare which is one is more effective at framing it as meaningful problem.
The first article comes from the Chinese University of Hong Kong:[8]
The second article is from Trinity College Dublin:[9]
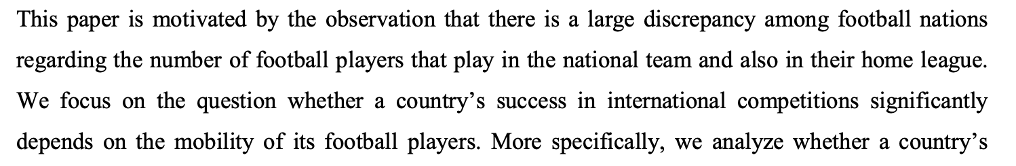
The third article is from the University of Nottingham:[10]
The fourth and last article is from Temple University:[11]
My personal reading is that only article 3 from Nottingham translates the research into a problem that could lead into a narrative. It effectively does so by observing that, despite football being a universal phenomenon, only a few countries enjoy success in the sport. As a Mexican-Canadian and big fan of the sport, that problem resonates with me. Wouldn’t be wonderful to compete in a World Cup at the highest level instead of watching the usual suspects win again and again? This longing is absent in Example 1, which seems to consider the variation in success in international football as curiosity, an oddity that merits their scholarly attention. For its part, Example 2 seems to put more importance on the resolution of the story than on the problem itself, changing the order in the plot line or series of events. Finally, Example 4 falls into a common academic mistake: justifying a research agenda based on a gap in the literature.
On this last point, and to further illustrate, I want to share a personal anecdote here:
Years ago, when I applied for the PhD program, I asked my MA supervisor if he could read the research proposal I included in my application. In typical fashion, my proposal started with pointing out a gap in the literature on democracy in Latin America, which my research would eventually fill. The comments I received from my supervisor were both humbling and enlightening. He said something like “Alejandro, there are many things that we don’t know, many gaps in the literature. That is ok, we don’t need to know everything, but we need to know how to solve the pressing problems that we have in the region. That’s where your research will be of value, not for filling a gap in the literature for the sake of filling a gap.” He might as well have said to me what the late John Kautsky of Washington University famously said once: “This paper fills a much needed gap in the literature.”[12]
To conclude, the lesson here for
would-be data storytellers, in social research as well as in business, is that
a story is as good as the problem it solves. Pick the wrong problem, or frame
it in the wrong angle, and your story is sure to flop. Stories, today as in
antiquity, need to talk to the depths of human consciousness, data and
technology notwithstanding.
[1] Dunbar, Robin IM. “Gossip in evolutionary perspective.” Review of general psychology 8, no. 2 (2004): 100-110.
[2] Article based on a homonymous lecture given for POL232 Introduction to Quantitative Reasoning II, University of Toronto. Winter 2021.
[3] https://literaryterms.net/story/
[4] https://en.wikipedia.org/wiki/The_Library_of_Babel
[5] Shapiro, Ian. “Problems, methods, and theories in the study of politics, or what’s wrong with political science and what to do about it.” Political theory 30, no. 4 (2002): 596-619.
[6] idem pp. 597
[7] idem pp. 598
[8] Wan, Kin-Man, Ka-U. Ng, and Thung-Hong Lin. “The Political Economy of Football: Democracy, Income Inequality, and Men’s National Football Performance.” Social Indicators Research 151, no. 3 (2020): 981-1013.
[9] Baur, Dirk G., and Sibylle Lehmann. “Does the mobility of football players influence the success of the national team.” Institute for International Integration Studies: Discussion Paper 217 (2007).
[10] Hoffmann, Robert, Lee Chew Ging, and Bala Ramasamy. “The socio-economic determinants of international soccer performance.” Journal of Applied economics 5, no. 2 (2002): 253-272.
[11] Leeds, Michael A., and Eva Marikova Leeds. “International soccer success and national institutions.” Journal of Sports Economics 10, no. 4 (2009): 369-390.
[12] Stimson, James A. “Professional Writing in Political Science: A Highly opinionated Essay.” (2010).
